3.8 RAS Monitoring
RAS monitoring encompasses the collection of all metrics & sensor related data from each node. It is primarily implemented under the ‘sensor’ framework present under the orcm project. It contains several plugins that monitor various metrics related to different features present in each node. These metrics range from sensor related ‘tangible’ information like Temperature, Voltage, Power Usage, etc. to non-tangible metrics related to OS parameters like, Memory Usage, Disk Usage, Process information, file monitoring, etc.
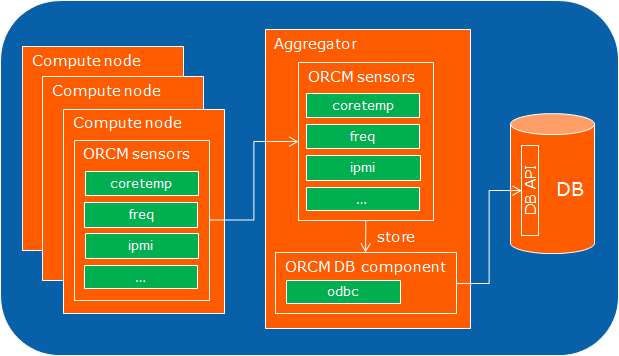
The RAS Monitoring in Sensys relies on the the Aggregator-Compute_Node model. All the sensor components running in each compute node scan the system and record metrics and send it to the aggregator, which acts as a collector and filters the data to be logged onto the database. A single exception to this is the IPMI plugin - contrary to running in the compute nodes and collecting the data, it runs actively only in the aggregator node, and collects the remote BMC's sensor data by issuing IPMI-over-LAN commands.
RAS monitoring is enabled by default in the Sensys, if it was configured during build time. Alternatively any of the sensor plugins can be selected or deselected by passing specific mca parameters. For example, for enabling only the sensor ipmi, coretemp, we need to pass:
orcmd --omca sensor heartbeat,ipmi,coretemp
Note that some sensors, such as ipmi, require orcmd to be run as root for access to the underlying metric collection.
Heartbeat is a special plugin under the sensor framework which collects a bucket of data holding all the sampled data metrics by each sensor and sends it to the aggregator, so we need to enable it every time we need collect sensor related data.
If no mca parameters are passed w.r.t. 'sensor' then the framework by default enables all the plugins that were are available and able to run. Some plugins contain special mca parameters that define certain special conditions in their functionality, the are listed under each corresponding plugin where ever applicable.
Apart from RAS monitoring, the sensor framework is also used to collect the inventory details of the compute nodes. The 'dmidata' plugin is a unique plugin which collects only the inventory information but doesn't collect any periodic metrics.
MCA Parameters for sensor framework:
- sensor_base_verbose: Set the verbosity level while launching the orcmd daemon. The amount of debug messages getting logged depends on the verbosity levels.
- sensor_base_sample_rate: Set the sampling rate at which each of the sensor components sample their respective metrics.
- sensor_base_log_samples: Enable/Disable logging the collected metrics into the database.
- sensor_base_collect_metrics: Enable collecton of the metrics.
- sensor_base_collect_inventory: Enable collecton of the inventory details.
- sensor_base_set_dynamic_inventory: N/A
- sensor_limit_sample_rate: The goal of this MCA parameter is to limit the user from setting the excessive sample rates for each node. This would act as a protection mechanism for limiting excessive load sent to the aggregator node. If a daemon have sensors with sample rates off limits, those values would be adjusted to the limit value; on the other hand, if the sample rate is changed via octl, an error would be thrown whenever the user set sampling rates beyond the limits via CLI. There is no default limit, and the feature would be disabled unless a limit is specified.
###3.8.1 coretemp
This component is used to read the DTS temperature sensor values from each Processor present in each compute node. The coretemp.ko kernel module needs to be loaded for this plugin to function. This can be done by running:
sudo modprobe coretemp
If this module is not present in the linux distro, then the lm-sensors package needs to be installed. See the instructions here.
MCA parameters:
- sensor_coretemp_test: Enable logging a random test sample by the plugin for testing sensor to database connectivity
- sensor_coretemp_enable_packagetemp: Enable/Disable collecting the package or die temperature. Enabled by default.
- sensor_coretemp_use_progress_thread: Enable coretemp to run on it's own separate thread.
- sensor_coretemp_sample_rate: If coretemp is running in a separate thread, then this parameter is used to configure the sample rate at which the data will be sampled.
###3.8.2 file
This component is used by applications to detect stalled programs. It tests to see if the specified file has been modified since the last time we looked, if it hasn't been touched for the specified number of times, then we declare the application to have stalled.
MCA parameters:
- sensor_file_file: The name of the file that needs to be monitored
- sensor_file_check_size: Boolean value to indicate whether the file size needs to be monitored or not.
- sensor_file_check_access: Boolean value to indicate whether the last access time has to be monitored or not.
- sensor_file_check_mod: Boolean value to indicate whether the last modified time has to be monitored or not.
- sensor_file_limit: Integer value indicating the maximum count before which the staleness of the file can be ignored, it is by default set to 3.
- sensor_file_test: Enable logging a random test sample by the plugin for testing sensor to database connectivity
- sensor_file_use_progress_thread: Enable file to run on it's own separate thread.
- sensor_file_sample_rate: If file is running in a separate thread, then this parameter is used to configure the sample rate at which the data will be sampled.
###3.8.3 freq
This component is used to read the CPU frequency scaling values from each Processor present in each compute node.
MCA parameters:
- sensor_freq_test: Enable logging a random test sample by the plugin for testing sensor to database connectivity
- sensor_freq_pstate: Enable collection of the intel_pstate related information
- sensor_freq_use_progress_thread: Enable freq to run on it's own separate thread.
- sensor_freq_sample_rate: If freq is running in a separate thread, then this parameter is used to configure the sample rate at which the data will be sampled.
###3.8.4 ft_tester
This component is used to test the fault tolerance/resilience of the system. This component will roll a random number generator each sampling time. If the lucky number hits, then the plugin will terminate either the indicated app proc or the daemon itself will kill itself, based on the specified parameter setting.
MCA parameters:
- sensor_ft_tester_fail_prob: Set an upper threshold probability value for killing a child process.
- sensor_ft_tester_multi_allowed: Boolean value to indicate whether multiple child processes should be killed or not.
- sensor_ft_tester_daemon_fail_prob: Set an upper threshold probability value for killing itself.
###3.8.5 heartbeat
This component is used to gather all the relevant data sampled by the other sensor components that have been enables and properly send that data to the appropriate log function.
###3.8.6 ipmi
This component is used to read IPMIUtil data from the BMC(s) present in each compute node using out of band communication. This is an OOB sensor, and it is intended to be run on the aggregator only. Currently, there is no support for running this sensor on compute nodes.
NOTE: Due to limitations in the BMC and/or the ipmiutil driver, the following conditions apply:
- Ipmi and nodepower sensors cannot be executed simultaneously on different threads.
- Ipmi and nodepower sensors may interfere with the OCTL command
chassis-id.
NOTE: The ipmi sensor plugin might take as long as a couple of minutes to perform inventory collection per BMC. In order to avoid a bottleneck on inventory collection, and potentially in collecting samples for BMCs reporting large volume of data, ipmi sensor should be run in a different thread than the other sensors (with the exception of nodepower sensor as mentioned above).
MCA parameters:
- sensor_ipmi_sensor_list: Used to set the list of BMC monitored sensor names whose value is to be retrieved. Use the sensor names stored in the BMC as defined in section 43.1. For example: "PS1 Power In,Processor 2 Fan,Fan 1"
- sensor_ipmi_sensor_group: Used to set the group of BMC monitored sensor names whose value is to be retrieved, any sensor whose name contains this term will be retrieved. For example: "Fan" (This will filter out all the sensors with the term 'fan' in it)
- sensor_ipmi_test: Enable logging a random test sample by the plugin for testing sensor to database connectivity
- sensor_ipmi_use_progress_thread: Enable ipmi to run on it's own separate thread.
- sensor_ipmi_sample_rate: If ipmi is running in a separate thread, then this parameter is used to configure the sample rate at which the data will be sampled.
- sensor_ipmi_sel_state_filename: When collecting IPMI SEL Records, this is the filename where the last read record ID is saved so the records are not re-read and stored multiple times in the database. Frequently "/var/run/orcmd-sel-persist.dat" is used. The default is no file which will cause all records to be re-read on orcmd startup.
Configuration file section:
The BMC lan parameters have to be configured in an XML file. This file should be located on <path/to/orcm/install>/etc and its
default name is orcm-default-config.xml. The syntax for the ipmi section is as follows:
One or more bmc_node tags. These tags should have the mandatory attribute name, being
the same as the compute node the BMC is related to. The following tags within the bmc_node are mandatory:
-
bmc_addressis the IP address of the BMC. This is not the same as the IP address of the node. -
useris the username of the remote BMC nodes for retrieving the metrics via the IPMI interface. -
passis the password of the remote BMC nodes for retrieving the metrics via the IPMI interface, for the above configured username. -
aggregatoris the aggregator retrieving the metrics.
The following tags within the bmc_node are optional:
-
auth_methodis the authentication method. Valid values are:NONE,MD2,MD5,UNUSED,PASSWORD,AUTH_OEM. The default value isPASSWORD. -
priv_levelis the privilege levels. Valid values are:CALLBACK,USER,OPERATOR,ADMIN,OEM. The default value isUSER.
Configuration section example:
<ipmi>
    <bmc_node name="node04">
        <bmc_address>192.168.0.104</bmc_address>
        <user>bmc_username_01</user>
        <pass>bmc_password_01</pass>
        <auth_method>PASSWORD</auth_method>
        <priv_level>USER</priv_level>
        <aggregator>agg01</aggregator>
    </bmc_node>
</ipmi>
The IPMI sensor plugin connects to the channel 1 of the BMC. Also, the default port for IPMI is used (623).
The file orcm-default-config.xml stores password fields for authentication in plain text format. For that reason, this
file should be restricted to authorized admin users, and the read and write permissions should be set accordingly.
###3.8.7 sigar
This component reads memory, swap memory, cpu load, disk, and network data for each compute node. This component is mutually exclusive with the resusage component. Which means that only one component can be operational at any given time. The metrics collected by this component are logged as 'procstat' or 'procstat_<process_name>' for per child process related metrics.
Please note that the exact list of metrics collected and in some cases the units of measurement could differ between these two components for some parameters.
MCA parameters:
- sensor_sigar_test: Enable logging a random test sample by the plugin for testing sensor to database connectivity
- sensor_sigar_mem: Enable collecting and logging memory usage details.
- sensor_sigar_swap: Enable collecting and logging swap memory usage details.
- sensor_sigar_cpu: Enable collecting and logging cpu usage details.
- sensor_sigar_load: Enable collecting and logging system load details.
- sensor_sigar_disk: Enable collecting and logging disk access details.
- sensor_sigar_network: Enable collecting and logging network usage details.
- sensor_sigar_sys: Enable collecting and logging system usage details.
- sensor_sigar_proc: Enable collecting and logging system wide process details as well as orcmd and child process details. Note that the child process stats will be logged into the database with the primary key - 'procstat_<child_name>. This also means that if orcm is launched from an emulator like valgrind it will be logged with a different primary key than 'procstat_orcm'
- sensor_sigar_use_progress_thread: Enable sigar to run on it's own separate thread.
- sensor_sigar_sample_rate: If sigar is running in a separate thread, then this parameter is used to configure the sample rate at which the data will be sampled.
###3.8.8 resusage
This is an alternative to the sigar component, which collects OS metrics by directly accessing the file system, without using any third party libraries. This component is mutually exclusive with the sigar component. Which means that only one component can be operational at any given time. The metrics collected by this component are logged as 'procstat' or 'procstat_<process_name>' for per child process related metrics.
Please note that the exact list of metrics collected and in some cases the units of measurement could differ between these two components for some parameters.
MCA parameters:
- sensor_resusage_sample_rate: N/A
- sensor_resusage_node_memory_limit: N/A
- sensor_resusage_proc_memory_limit: N/A
- sensor_resusage_log_node_stats: Whether the sampled node status information is to be sent to the log function for further processing.
- sensor_resusage_log_process_stats: Whether the sampled process status information is to be sent to the log function for further processing.
- sensor_resusage_test: Enable logging a random test sample by the plugin for testing sensor to database connectivity
- sensor_resusage_use_progress_thread: Enable resusage to run on it's own separate thread.
- sensor_resusage_sample_rate: If resusage is running in a separate thread, then this parameter is used to configure the sample rate at which the data will be sampled.
###3.8.9 nodepower
This component is used to read node power using raw commands supported by PSUs. Currently the input power to PSUs is reported.
NOTE: Due to limitations in the BMC and/or the ipmiutil driver, the following conditions apply:
- Nodepower and ipmi sensors cannot be executed simultaneously on different threads. The ipmi sensor plugin might take as long as a couple of minutes per BMC to perform inventory collection; this bottleneck, and a potential bottleneck in collecting samples for BMCs reporting large volume of data, might affect nodepower sampling.
- Nodepower and ipmi sensors may interfere with the OCTL command
chassis-id.
MCA parameters:
- sensor_nodepower_use_progress_thread: Enable nodepower to run on it's own separate thread.
- sensor_nodepower_sample_rate: If nodepower is running in a separate thread, then this parameter is used to configure the sample rate at which the data will be sampled.
###3.8.10 componentpower
This component is used to read CPU and DDR power using RAPL MSRs.
MCA parameters:
- sensor_componentpower_use_progress_thread: Enable componentpower to run on it's own separate thread.
- sensor_componentpower_sample_rate: If componentpower is running in a separate thread, then this parameter is used to configure the sample rate at which the data will be sampled.
###3.8.11 dmidata
This component is used to collect the inventory information from the node
MCA parameters:
- sensor_dmidata_test: Enable logging a random test sample by the plugin for testing sensor to database connectivity
- sensor_dmidata_ntw_dev: Enable collecting the network interface details
- sensor_dmidata_blk_dev: Enable collecting the block/hard drive details
- sensor_dmidata_mem_dev: Enable collecting memory module details.
- sensor_dmidata_pci_dev: Enable collecting PCI devices details (Needed for collecting ntw.blk,mem device details)
- sensor_dmidata_freq_steps: Enable collection of the available frequency steps at which the CPU can be configured to run.
###3.8.12 mcedata
This component is used to collect the Machine Check Errors (MCE) that have been encountered by the OS. The open source 'mcelog' daemon has to run in the background. It also needs to run in the 'raw' mode, for mcedata plugin to extract the data accurately.
Note: Due to a kernel bug in machinecheck handling, the edac driver has to be disabled in order for mcelog to collect all the memory module related errors. This bug is fixed in v4.0-rc1 kernel release.
The following types of errors are currently read and decoded:
- Cache Errors
- Memory Controller Errors
- Bus & Interconnect Errors
MCA parameters:
- sensor_mcedata_logfile: Pass the path to the logfile into which mcelog stores the recorded errors. It must match the logfile configured in mcelog.conf
- sensor_mcedata_use_progress_thread: Enable mcedata to run on it's own separate thread.
- sensor_mcedata_sample_rate: If mcedata is running in a separate thread, then this parameter is used to configure the sample rate at which the Machine Check Event occurrences will be sampled.
###3.8.13 syslog
This component is used to identify syslog entries and, depending on the criticality, send notifications to the administrators. Critical and non-critical entries will be recorded in the database.
Note: the syslog component expects SELinux to be disabled when used. Functionality of the syslog component cannot be guaranteed if SELinux is enabled.
MCA parameters:
- sensor_syslog_use_progress_thread: Enable syslog to run on it's own separate thread
- sensor_syslog_sample_rate: If syslog is running in a separate thread, then this parameter is used to configure the sample rate at which the data will be sampled
In order to get the syslog sensor working you need to meet this environment:
- Installation of rsyslog server (rsyslogd).
- Sensys scheduler running, it can be launched from: # <orcm_install_path>/bin/orcmsched
- Execute Sensys with the desired sensor which we want to use for analytics, i.e.: # <orcm_install_path>/bin/orcmd --omca sensor syslog,heartbeat --omca analytics_base_verbose 100
- Execute OCTL to activate the workflow xml file which we created, i.e.: # <orcm_install_path>/bin/octl workflow add <path_to_workflow_xml_file>
Additionally to that, the syslog sensor needs a workflow xml file with the following content:
<?xml version="1.0" encoding="UTF-8" standalone="no" ?>
<workflows>
<aggregator>*aggregator_name*</aggregator>
<workflow name = "wf1">
    <step name = "filter">
        <data_group>syslog</data_group>
    </step>
    <step name = "genex">
        <msg_regex>access granted</msg_regex>
        <severity>info</severity>
        <notifier>smtp</notifier>
    </step>
</workflow>
</workflows>
- aggregator tag: Specifies the list of nodes in which the workflow will be tracked.
- data_group: A sensor list which will interact with the analytics framework, this list is separated by a semicolon. i.e. “syslog;freq;coretemp”
- genex section: Has the arguments set for a given sensor. Arguments can change depending on which sensor is specified, for syslog sensor you can specify the following arguments:
- msg_regex: Regular expression to filter which messages are going to be send to notification framework.
- severity: Message severity which has to be met in order to send it to notification framework.
- notifier: The notifier logging method option for event notifications.
The rsyslog service support additional configuration files than can be placed inside a configuration directory (/etc/rsyslog.d, in the case of supported Linux distributions – SLES and RHEL). This file would contain the required configuration to communicate rsyslog and Sensys, as well as the configuration required for the communication between Journal and rsyslog, and filter the messages for redirection.
For example, the configuration file might look like this:
$ModLoad imuxsock
$AddUnixListenSocket /run/systemd/journal/syslog
$ModLoad omuxsock
$OMUxSockSocket /dev/orcm_log
*.alert;*.crit;*.err;auth.warn;authpriv.warn;kern.warn;user.warn;daemon.warn;cron.warn :omuxsock:
###3.8.14 errcounts
This component collects the uncorrectable and correctable ECC memory error counts from the EDAC sysfs entries. This is mostly intended for the analytic framework plugins to consume since these values are only relative to to each other by time and are reset on each reboot. The mcedata plugin above should be used if you require historical data and more details about the ECC errors.
The only MCA parameters associated with this plugin is the "sensor_errcounts_sample_rate" and "sensor_errcounts_use_progress_thread" which like other plugins allows a per-plugin sample rate and seperate threads for sampling to be set.
This plugin returns data in about 1-10ms so per-thread sampling may not be optimal for this plugin.
Use the following configuration line to include in the configure step of Sensys:
- with_errcounts=yes
###3.8.15 snmp
This component is used to read variables from SNMP devices. This is an OOB sensor, and it is intended to be run on the aggregator only. Currently, there is no support for running this sensor on compute nodes.
MCA parameters:
-
sensor_snmp_use_progress_thread: Enable syslog to run on its own separate thread -
sensor_snmp_sample_rate: If syslog is running in a separate thread, then this parameter is used to configure the sample rate at which the data will be sampled
Configuration file sections:
The SNMP lan parameters and variables have to be configured in an XML file. This file should be located on
<path/to/orcm/install>/etc and its default name is orcm-default-config.xml. The syntax for the snmp section
is as follows:
Each device should be configured using a config tag. A mandatory name attribute should be specified. The following attributes should be specified as well:
- SNMPv1 Devices:
version=1-
user, is the community user of the device. -
location, an optional argument for providing additional info for locating the device.
- SNMPv3 Devices:
version=3-
user, is the username of the credential to access the device. -
pass, is the password of the credential to access the device. -
auth, is the encryption mechanism. This can beMD5orSHA1. It defaults toMD5. -
sec, is the security access method. This can beNOAUTH,AUTHNOPRIV,AUTHPRIV. It defaults toAUTHNOPRIV. In case of usingAUTHPRIV, the default protocol on Net-SNMP library will be used (DESin most cases, unless being disabled at compile time in the library). -
location, an optional argument for providing additional info for locating the device.
Within the config section, the following tags should be provided (mandatory):
-
aggregator, is a single string specifying which aggregator would be in charge of collecting the SNMP data of the device. -
hostname, is the device hostname or ip address. This can be a comma separated list, logical group and/or regular expression. -
oids, is the comma separated list of oids to query. Both numerical OIDs and textual MIB names are supported.
In order to use MIB (Management Information Base) names, MIB database files needs to be installed in a location reachable by Net-SNMP library. These databases are vendor dependent, and should be obtained from vendor websites. These files might use propietary licenses and the user is responsible on attaining to those.
In a per user basis, the MIB files should be copied into: $HOME/.snmp/mibs/. For global use of these files, they should
be copied into: /usr/share/snmp/mibs. In the IMPORT section of the MIB file, we can check for the dependencies upon
other MIB files.
Configuration section example:
<snmp>
    <config name="snmp1" version="3" user="user" pass="12345678" auth="MD5" sec="AUTHNOPRIV">
        <aggregator>localhost</aggregator>
        <hostname>server[2:0-20],server21</hostname>
        <oids>1.3.6.1.4.1.343.1.1.3.1,1.3.6.1.4.1.343.1.1.3.4</oids>
    </config>
    <config name="snmp2" version="1" user="user" location="X Lab">
        <aggregator>node01</aggregator>
        <hostname>switches[2:0-20],switch21</hostname>
        <oids>1.3.6.1.4.1.343.1.1.3.1,1.3.6.1.4.1.343.1.1.3.4</oids>
    </config>
</snmp>
Note: Buffer overflow in net-snmp library, see bug 2568. This issue might be hit by SenSys when using a configuration with an unavailable OID after several attempts to sample such an OID. Patch available on net-snmp, commit af8c1. Affected net-snmp versions: 5.7.2 and 5.7.3. Those versions have been proved to fail, nevertheless, there may be more that fail.
The file orcm-default-config.xml stores password fields for authentication in plain text format. For that reason, this
file should be restricted to authorized admin users, and the read and write permissions should be set accordingly.
###3.8.16 Data Flow
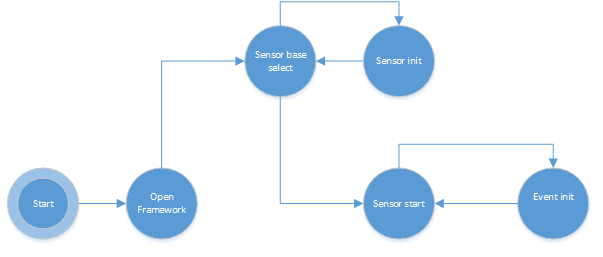
Before sampling data using any of the underlying components, the framework and in effect each component has to be initialized. This is required for detecting the available plugins and verifying their underlying dependencies are met. Initialization stage also provides a safe state to allocate memory/space that's required for the component's functioning.
The base framework also detects the priority assigned for each component and selects the plugin with the highest priority in case of conflicting "component name". This step also calls the init functions of each component in effect instructing them to initialize their structures/memories and check for any particular dependencies. If anything is not in order and the init sequence fails, then the sensors framework removes the concerned plugin from it's 'bucket' list and in turn from sampling that particular metric(s).
The sensors framework's start call in turn sets up an event loop with a user defined time interval, with a specific callback function - "manually_sample", which gets invoked at after each trigger.
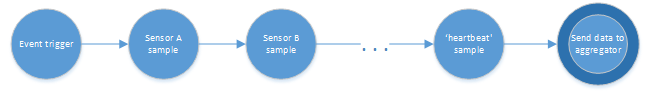
The sampling stage of the sensors is pretty simple. The event loop (setup during the initialization stage) triggers after every sampling period and invokes the sample function of call of each active module. The order of selecting the sample function is based on the priority of each component and is assigned by the developer. Each components 'samples' their respective metrics and packs it into a large bucket, preceded with a string containing the plugin's name. The plugin with the lowest priority is the heartbeat plugin and it gets invoked the last. This is a special plugin in the sense that it it takes the packed buffer and sends it the aggregator, via the RML layer's send call by using a dedicated tag.
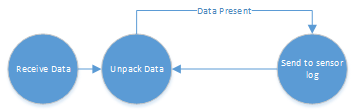
This state is valid only for the aggregator nodes, since the packed RAS metric data sent by the heartbeat plugin is 'always' directed at the aggregator node. Once the aggregator node received the buffer, it unpacks it and directs the contents to the log function of the respective component. This is possible since each component is expected to pack it's name preceding the metric contents.

Once the user application decides to stop sampling the metric data, it can invoke the finalize function call of the base framework which in turn removes the event from the event loop.
NOTE: All the above explanation is valid for a single thread sampling. Per-thread sampling is slightly different from the above process. TBD