This script attempts to produce WIMD 2019 ranks for MSOAs in a very dubious manner.
(You can find the output of the script in the output directory.)
The Welsh Index of Multiple Deprivation (WIMD) ranks 1909 small areas of Wales from most to least deprived. These small areas are known as Lower Super Output Areas (LSOAs). It's useful for many things, including investigating if other metrics are related to deprivation.
Some data from other sources, for example rates of COVID-19 cases, is only made available for the 410 slightly larger areas called Middle Super Output Areas (MSOAs). This makes it difficult to investigate how this data compares with WIMD.
This script combines two different metrics to try to produce WIMD-like ranks for MSOAs:
- Proportion of each MSOA's population resident in the most and least deprived LSOAs.
- Each MSOA's population-weighted average of its LSOAs' WIMD scores.
The first of these starts by looking at the proportion of each MSOA's population in the 50% most deprived LSOAs, then the 30% most deprived LSOAs and various other cut-offs, weighted to emphasise some more than others but ensure a decent degree of agreement with all.
The chart below shows the agreement between quintiles generated using only each cut-off and the quintiles generated by this script:
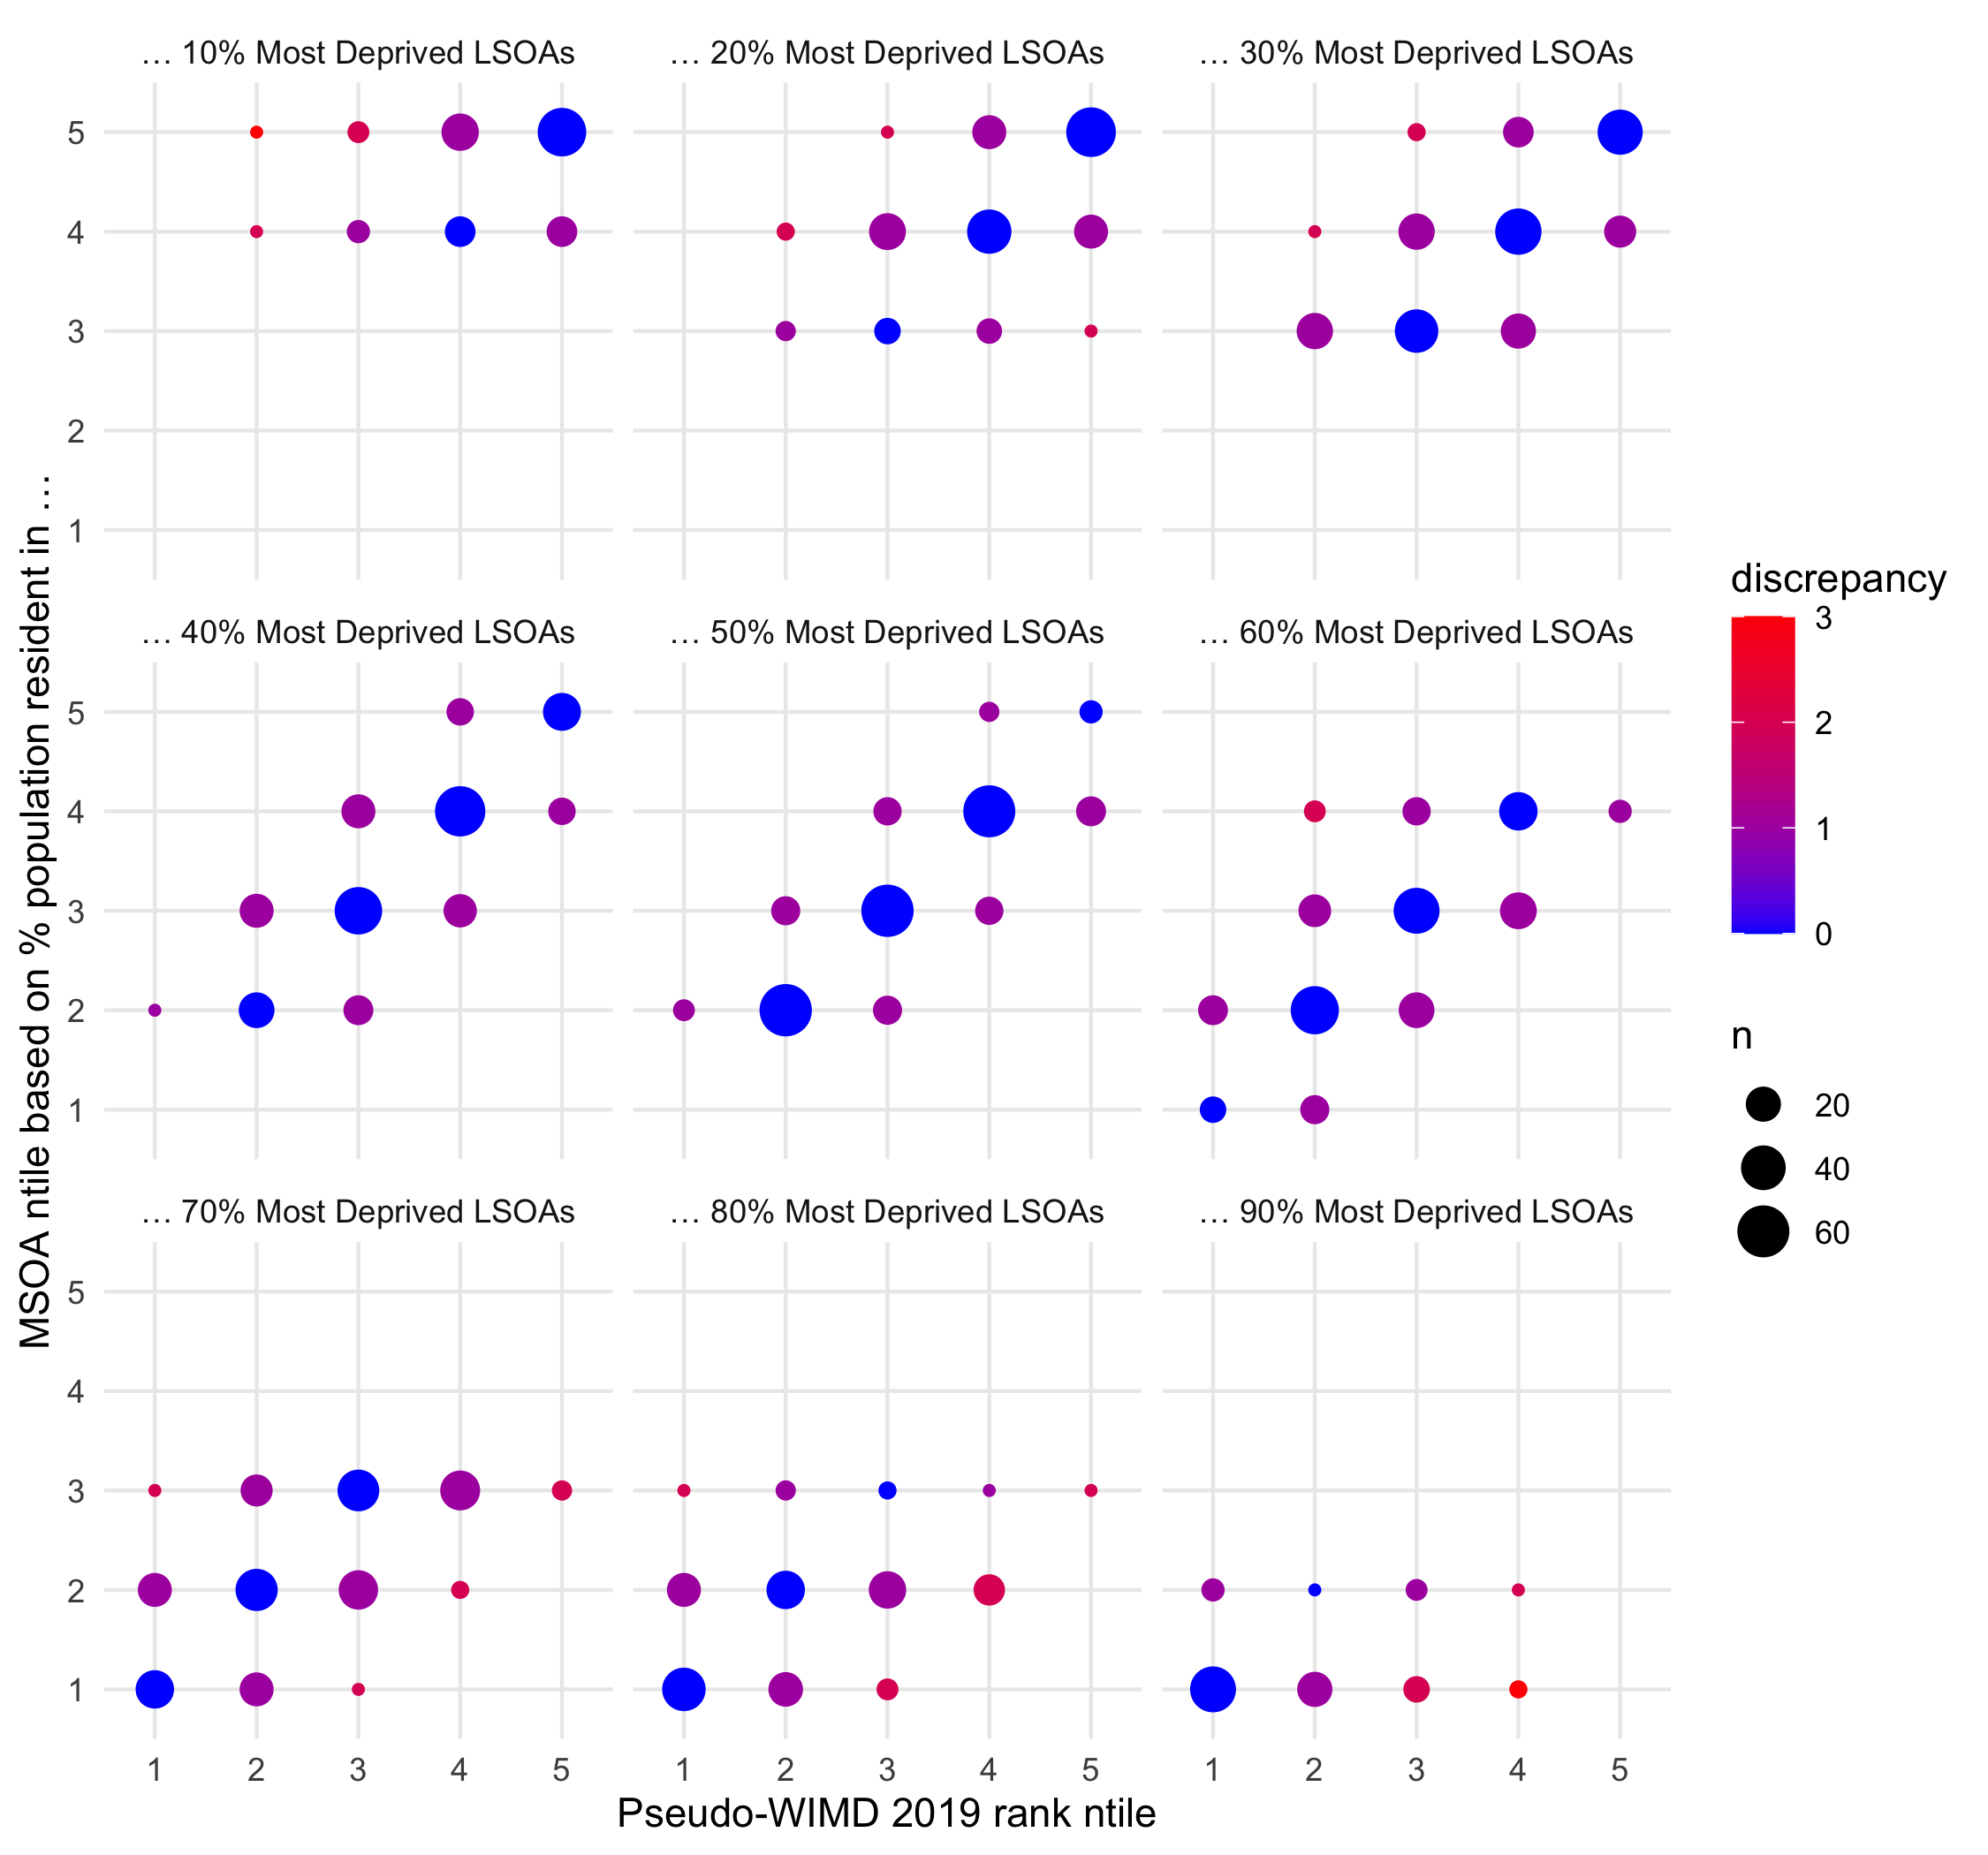
(MSOAs where the proportion of the population in the x% most deprived is either 0% or 100% are not included in the above chart.)
The WIMD guidance explictly tells you not to do the second of these:
It is not valid to aggregate the ranks or scores to larger geographies by taking an average of the values for the small areas.
(This is in contrast to the advice provided for aggregating English Indices of Deprivation; the scores for the two Indices have different properties.)
This population-weighted average is only used as a last resort to try to disambiguate the ranks of the very least and most deprived MSOAs.
Consider using quintiles or deciles.
If you're looking at an area smaller than all of Wales, e.g. Merthyr Tydfil, then consider reranking within that area.
Be aware that some MSOAs contain enormous variation in deprivation. For example, Birchgrove in Swansea contains both one of the most and one of the least deprived LSOAs in the country. (This script ranks the Birchgrove MSOA as the 254th most deprived out of 410 MSOAs in Wales.)
I believe all the data is licensed under either the Open Government License or Open Parliament License.
https://gov.wales/welsh-index-multiple-deprivation-full-index-update-ranks-2019