Skip to content

This repository serve as a reference guide for creating various types of data visualizations using Python. It will feature over 25 visualizations.

License

Notifications You must be signed in to change notification settings

soareseric/data-visualization-with-python

Folders and files

NameName
Last commit message
Last commit date

Latest commit


History

3 Commits


Repository files navigation

Data Visualization with Python

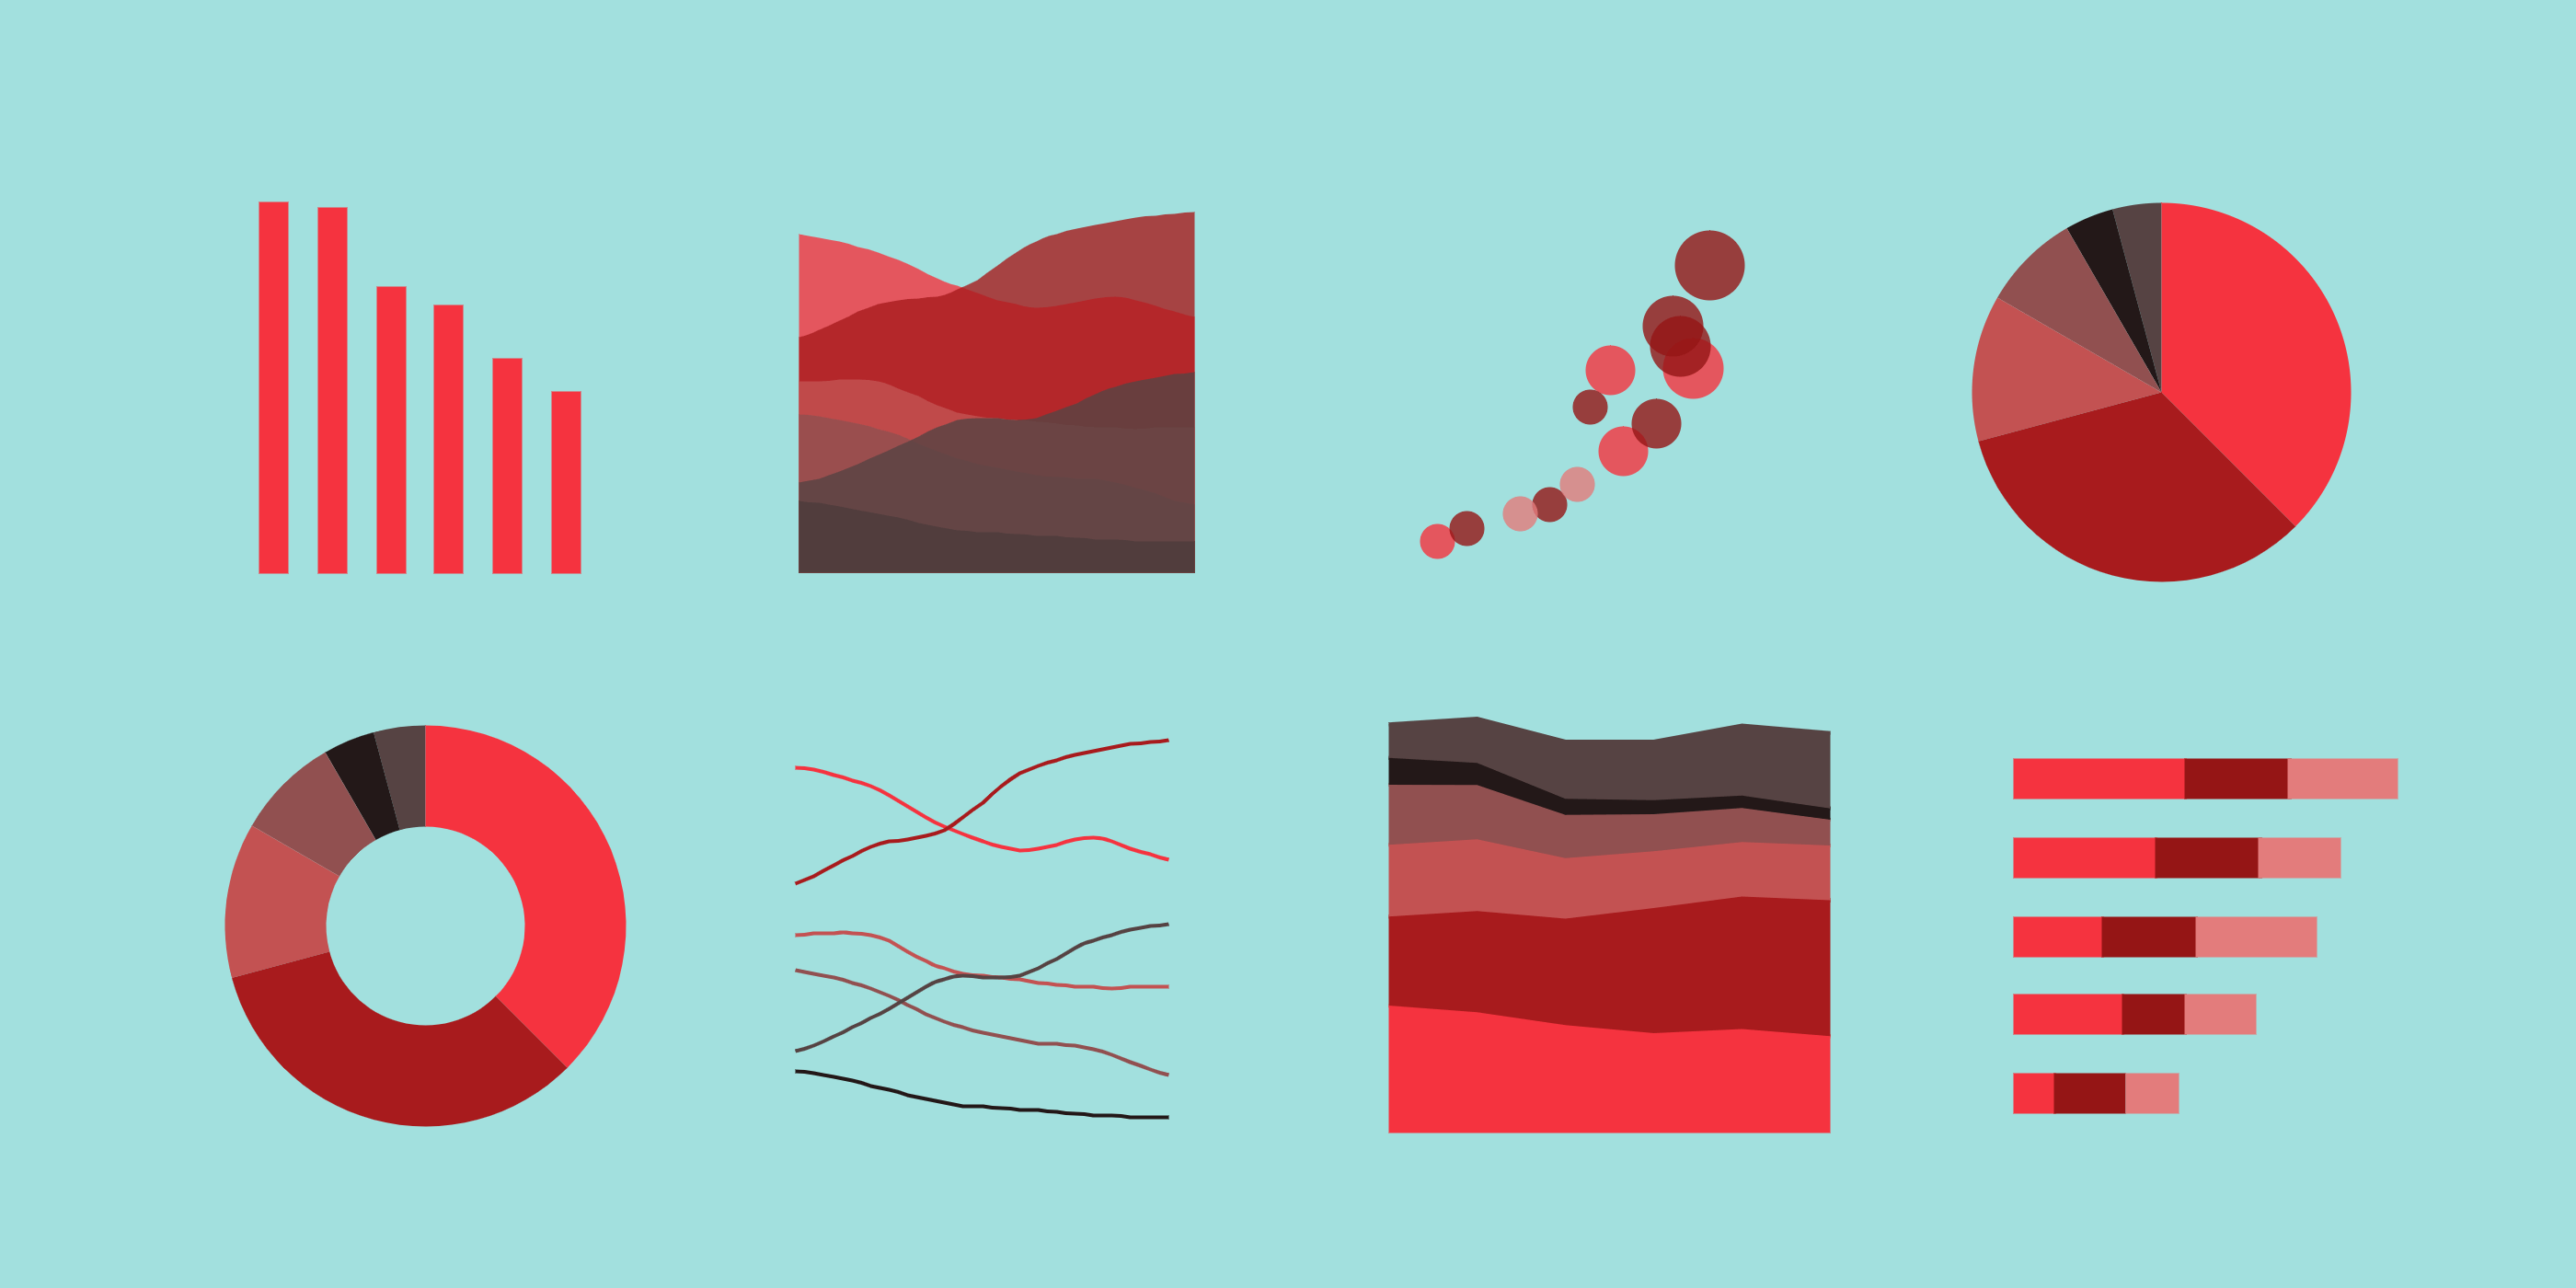
The purpose of this repository is to serve as a reference guide for creating various types of data visualizations using Python. Upon completion, it will feature over 25 visualizations, utilizing more than 5 datasets, some of which will be scraped from websites.

Dataviz

Technologies used

  • Python

Python Libraries used

  • Matplolib
  • Pandas
  • NumPy
  • Seaborn

Datasets from:

https://archive-beta.ics.uci.edu/

Data Visualizations:

Dataset:

Dataviz 01 - A Scatter Plot represents the relationship between two variables

under development

Dataviz 02 - Scatter Plot showing the relationship between two variables with the points colored based on categories of a third variable.

under development
Contact me 🔗 👇

EricSoares EricSoares

About

This repository serve as a reference guide for creating various types of data visualizations using Python. It will feature over 25 visualizations.

Topics

Resources

License

Stars

Watchers

Forks

Releases

No releases published

Packages

No packages published