Monitoring and Alerting
This section explains how Milvus uses Prometheus to monitor metrics and Grafana to visualize metrics and create alerts.
Prometheus is an open-source monitoring and alerting toolkit for Kubernetes implementations. It collects and stores metrics as time-series data. This means that metrics are stored with timestamps when recorded, alongside with optional key-value pairs called labels. Currently Milvus uses the following components of Prometheus:
- Prometheus endpoint to pull data from endpoints set by exporters.
- Prometheus operator to effectively manage Prometheus monitoring instances.
- Kube-prometheus to provide easy to operate end-to-end Kubernetes cluster monitoring.
Grafana is a visualizing stack. It features a dashboard that can help you visualize all the data and metrics you need. With the Grafana dashboard, you can query, understand, and analyze your data.
This section describes how to use Prometheus to deploy monitoring services for a Milvus cluster on Kubernetes.
Metrics are indicators providing information about the running status of your system. For example, with metrics, you can understand how much memory or CPU resources are consumed by a data node in Milvus. Being aware of the performance and status of the components in your Milvus cluster makes you well-informed and hence making better decisions and adjusting resource allocation in a more timely manner.
Generally, metrics are stored in a time series database (TSDB), like Prometheus, and the metrics are recorded with a timestamp. In the case of monitoring Milvus services, you can use Prometheus to pull data from endpoints set by exporters. Prometheus then exports metrics of each Milvus component at http://<component-host>:9091/metrics.
However, you might have several replicas for one component, which makes manual configuration of Prometheus too complicated. Therefore, you can use Prometheus Operator, an extension to Kubernetes, for automated and effective management of Prometheus monitoring instances. Using Prometheus Operator saves you the trouble of manually adding metric targets and service providers.
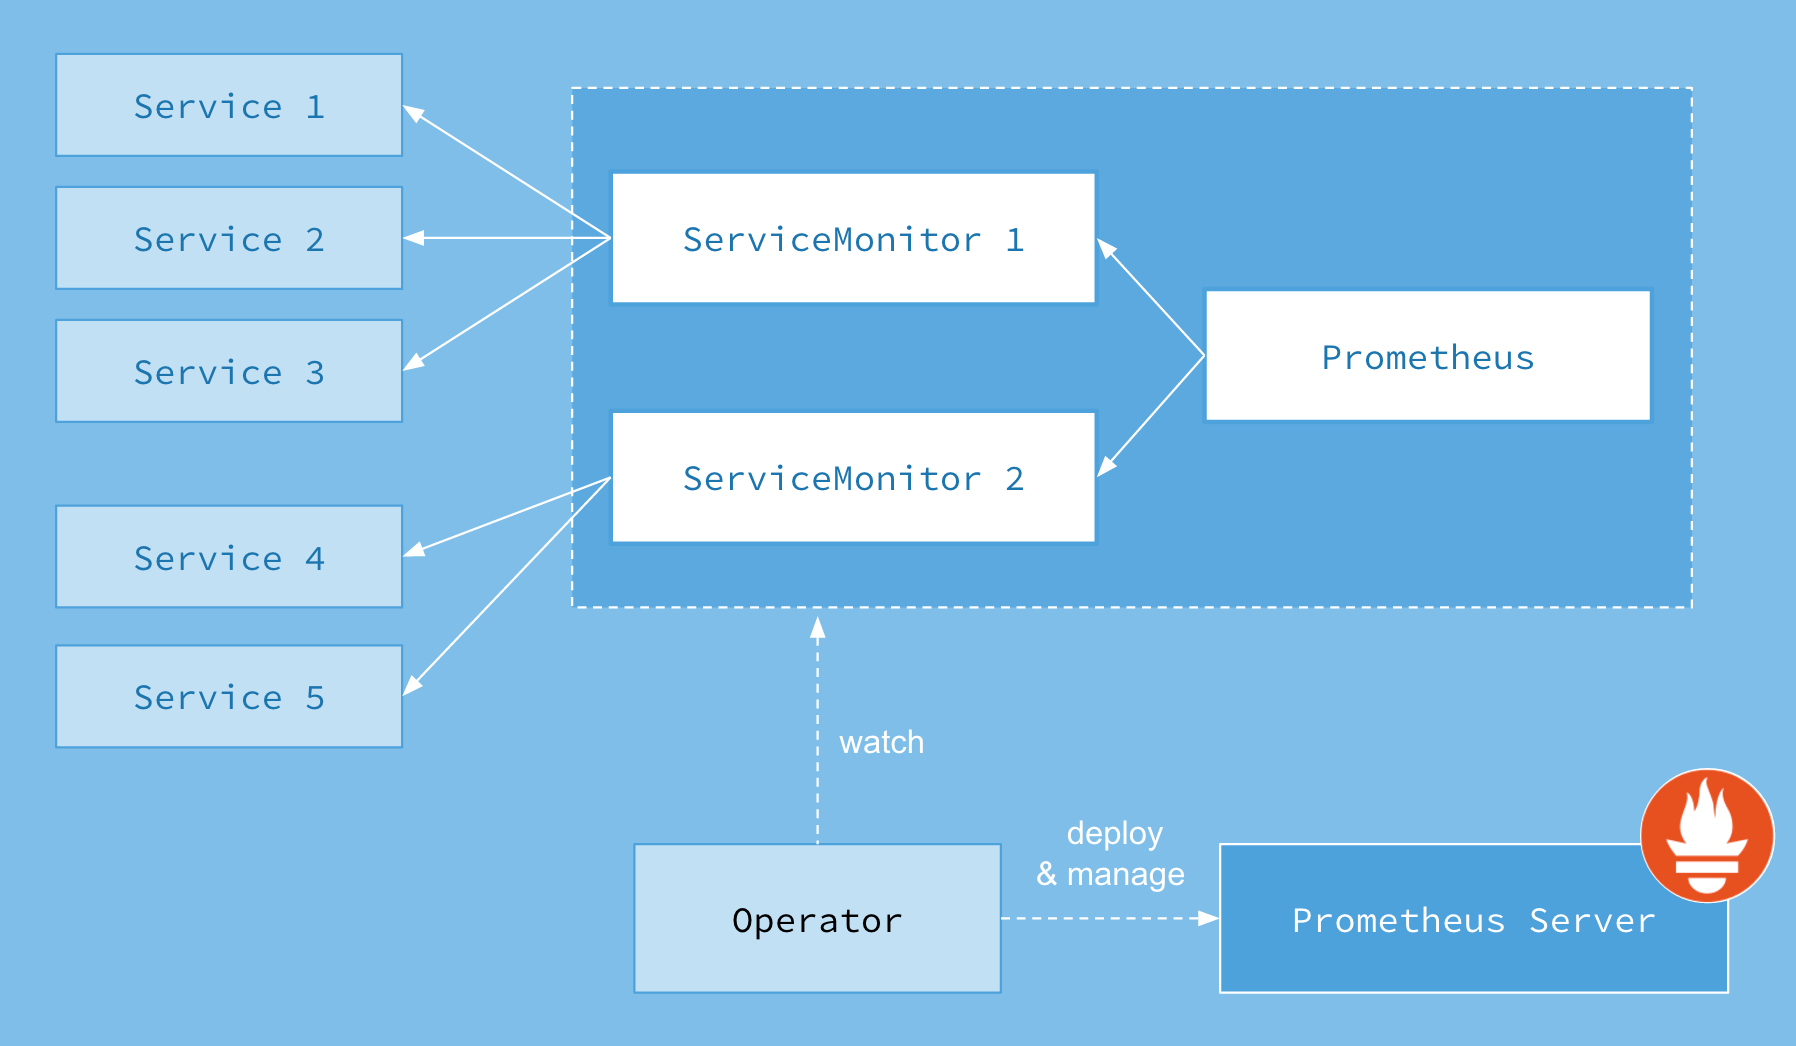
The ServiceMonitor Custom Resource Definition (CRD) enables you to declaratively define how a dynamic set of services are monitored. It also allows selecting which services to monitor with the desired configuration using label selections. With Prometheus Operator, you can introduce conventions specifying how metrics are exposed. New services can be automatically discovered following the convention you set without the need for manual reconfiguration.
The following image illustrates Prometheus workflow.
This tutorial uses kube-prometheus to save you the trouble of installing and manually configuring each monitoring and alerting component.
Kube-prometheus collects Kubernetes manifests, Grafana dashboards, and Prometheus rules combined with documentation and scripts.
Before deploying monitoring services, you need to create a monitoring stack by using the configuration in the kube-prometheus manifests directory.
git clone https://github.com/prometheus-operator/kube-prometheus.git
kubectl create -f manifests/setup
until kubectl get servicemonitors --all-namespaces ; do date; sleep 1; echo ""; done
kubectl create -f manifests/
To delete a stack, run kubectl delete --ignore-not-found=true -f manifests/ -f manifests/setup.
You can access Prometheus via http://localhost:9090, and Grafana at http://localhost:3000.
kubectl --namespace monitoring port-forward svc/prometheus-k8s 9090
kubectl --namespace monitoring port-forward svc/grafana 3000
The ServiceMonitor is not enabled for Milvus Helm by default. After installing the Prometheus Operator in the Kubernetes cluster, you can enable it by adding the parameter metrics.serviceMontior.enabled=true.
helm install my-release milvus/milvus --set metrics.serviceMonitor.enabled=true
When the installation completes, use kubectl to check the ServiceMonitor resource.
kubectl get servicemonitor
NAME                           AGE
my-release-milvus              54s
This section describes how to visualize Milvus metrics using Grafana.
As described in the monitoring guide, metrics contain useful information such as how much memory is used by a specific Milvus component. Monitoring metrics helps you better understand Milvus performance and its running status so that you can adjust resource allocation timely.
Visualization is a chart showing the change of resource usage across time, which makes it easier for you to quickly see and notice the changes to resource usage especially when an event occurs.
This tutorial uses Grafana, an open-source platform for time-series analytics, to visualize various performance metrics of Milvus.
You need to configure Prometheus to monitor and collect metrics before using Grafana to visualize the metrics. If the setup is successful, you can access Grafana at http://localhost:3000. Or you can also access Grafana using the default Grafana user:password of admin:admin.
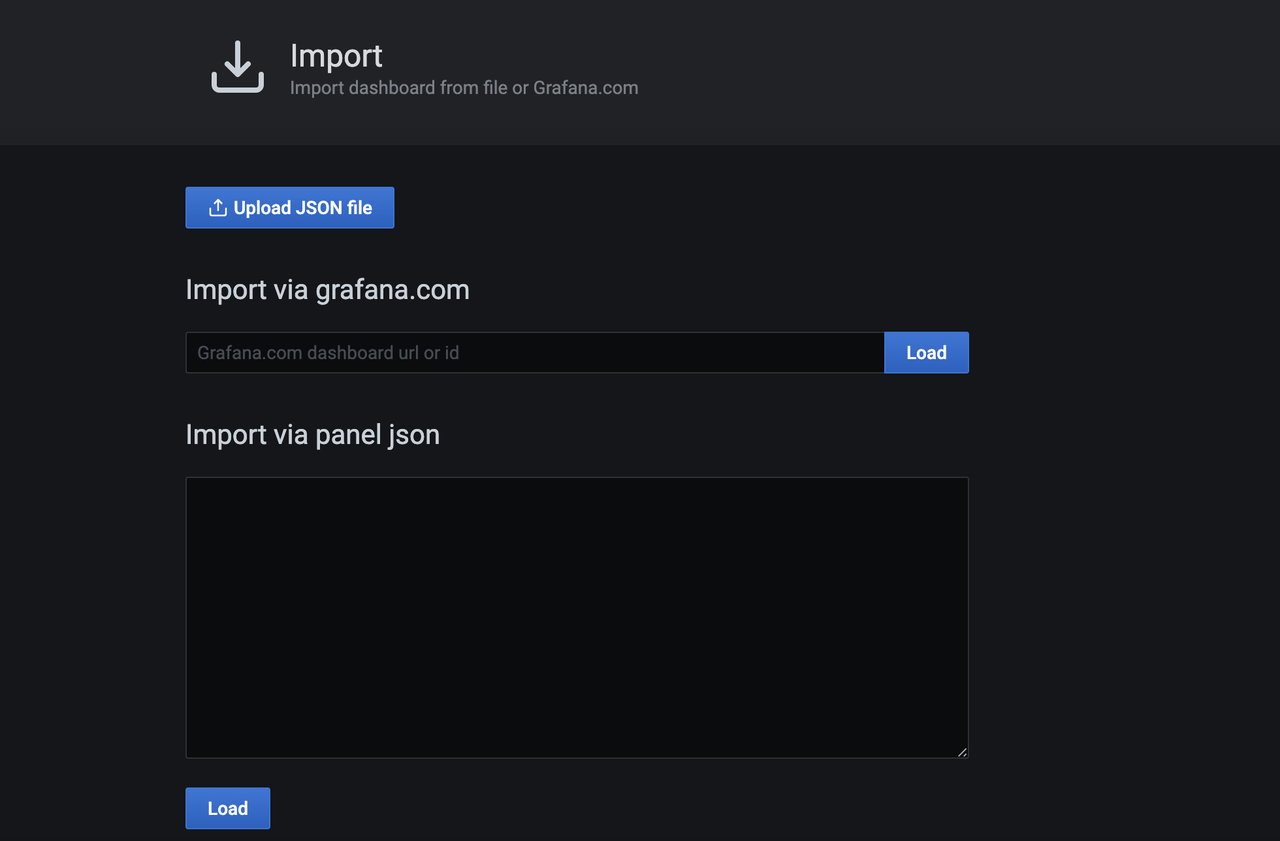
Download and import Milvus dashboard from the JSON file.
wget https://raw.githubusercontent.com/milvus-io/milvus/master/deployments/monitor/grafana/milvus-dashboard.json
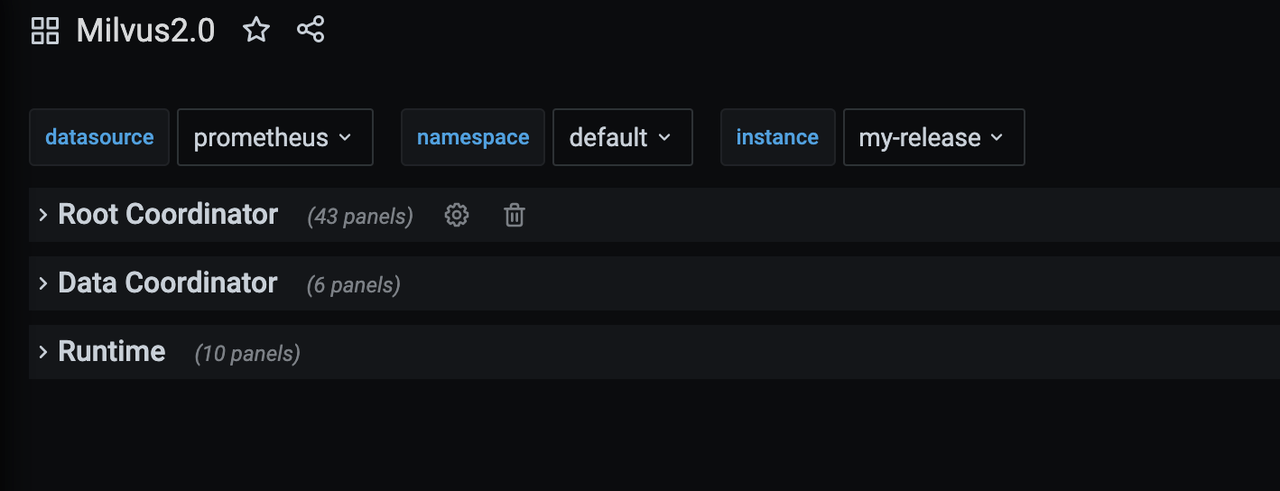
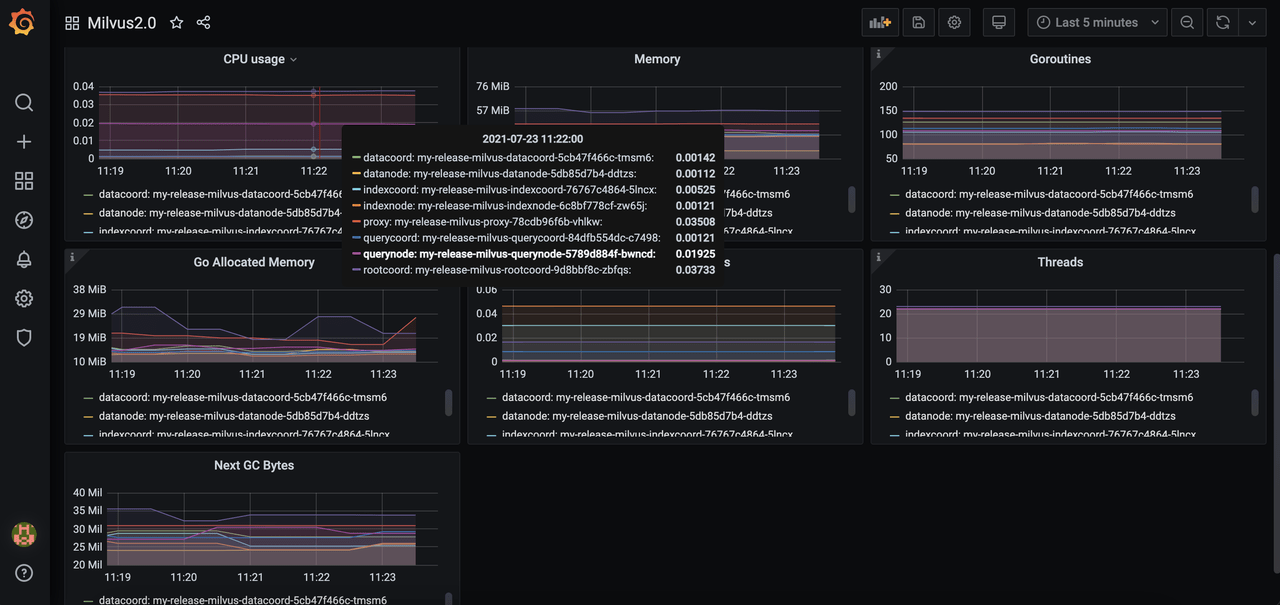
Select the Milvus instance you want to monitor. Then you can see the Milvus components panel.
This topic introduces the alert mechanism for Milvus services and explains why, when, and how to create alerts in Milvus.
By creating alerts, you can receive notifications when the value of a specific metric exceeds the threshold you have predefined.
For example, you create an alert and set 80 MB as the maximum value for memory usage by Milvus components. If the actual usage exceeds the predefined number, you will receive alerts reminding you that the memory usage by Milvus component surpasses 80 MB. Upon the alert, you can then adjust the allocation of resources accordingly and timely to ensure service availability.
Below are some common scenarios where you need to create an alert for.
- CPU or memory usage by Milvus components is too high.
- Milvus component pods are running low on disk space.
- Milvus component pods are restarting too frequently.
The following metrics are available for alerting configuration:
| Metric | Description | Unit of measure |
|---|---|---|
| CPU Usage | CPU usage by Milvus components that is indicated by the running time of CPU. | Second |
| Memory | Memory resources consumed by Milvus components. | MB |
| Goroutines | Concurrent executing activities in GO language. | / |
| OS Threads | Threads, or lightweight processes in an operating system. | / |
| Process Opened Fds | The current number of used file descriptors. | / |
This guide takes the example of creating an alert for the memory usage of Milvus components. To create other types of alerts, please adjust your commands accordingly. If you encounter any problems during the process, feel free to ask in the Milvus forum or initiate a discussion on Slack.
This tutorial assumes that you have Grafana installed and configured. If not, we recommend reading the monitoring guide.
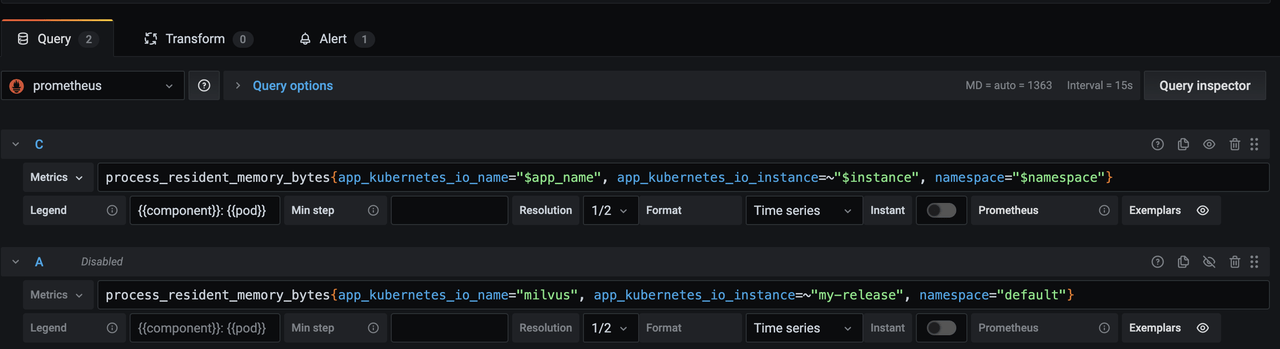
To add an alert for the memory usage of Milvus components, edit the Memory panel. Then, add a new query with the metric: process_resident_memory_bytes{app_kubernetes_io_name="milvus", app_kubernetes_io_instance=~"my-release", namespace="default"}

Save the dashboard, and wait for a few minutes to see the alert.
Grafana alert query does not support template variables. Therefore, you should add a second query without any template variables in the labels. The second query is named as "A" by default. You can rename it by clicking on the dropdown.
To receive alert notifications, add a "notification channel". Then, specify the channel in the field "Send to".

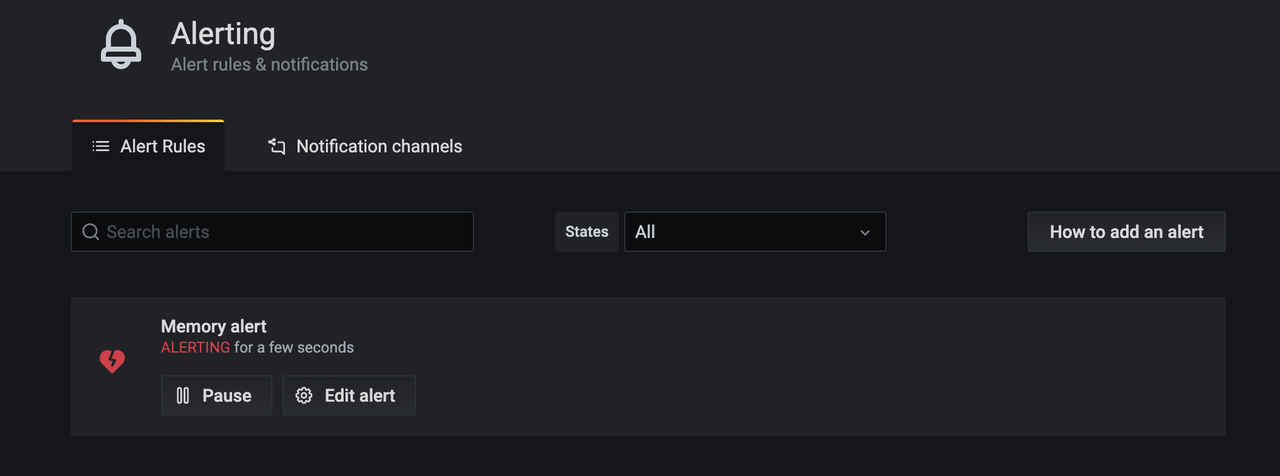
If the alert is successfully created and triggered, you will receive the notification as shown in the screenshot below.

To delete an alert, go to the "Alert" panel and click the delete button.
