Limited implementation of the parallelization techniques discussed in Section 3.3 of the original RAPTOR paper.
Briefly, the goal is to create an undirected "conflict graph" of all transit routes in a network and output a graph coloring (specifically a vertex coloring) of the graph such that all transit routes that share a stop are colored differently.
The resulting graph coloring can be used to determine an ordering to safely traverse routes (Algorithm 1 L15) in parallel without worrying about shared memory corruption.
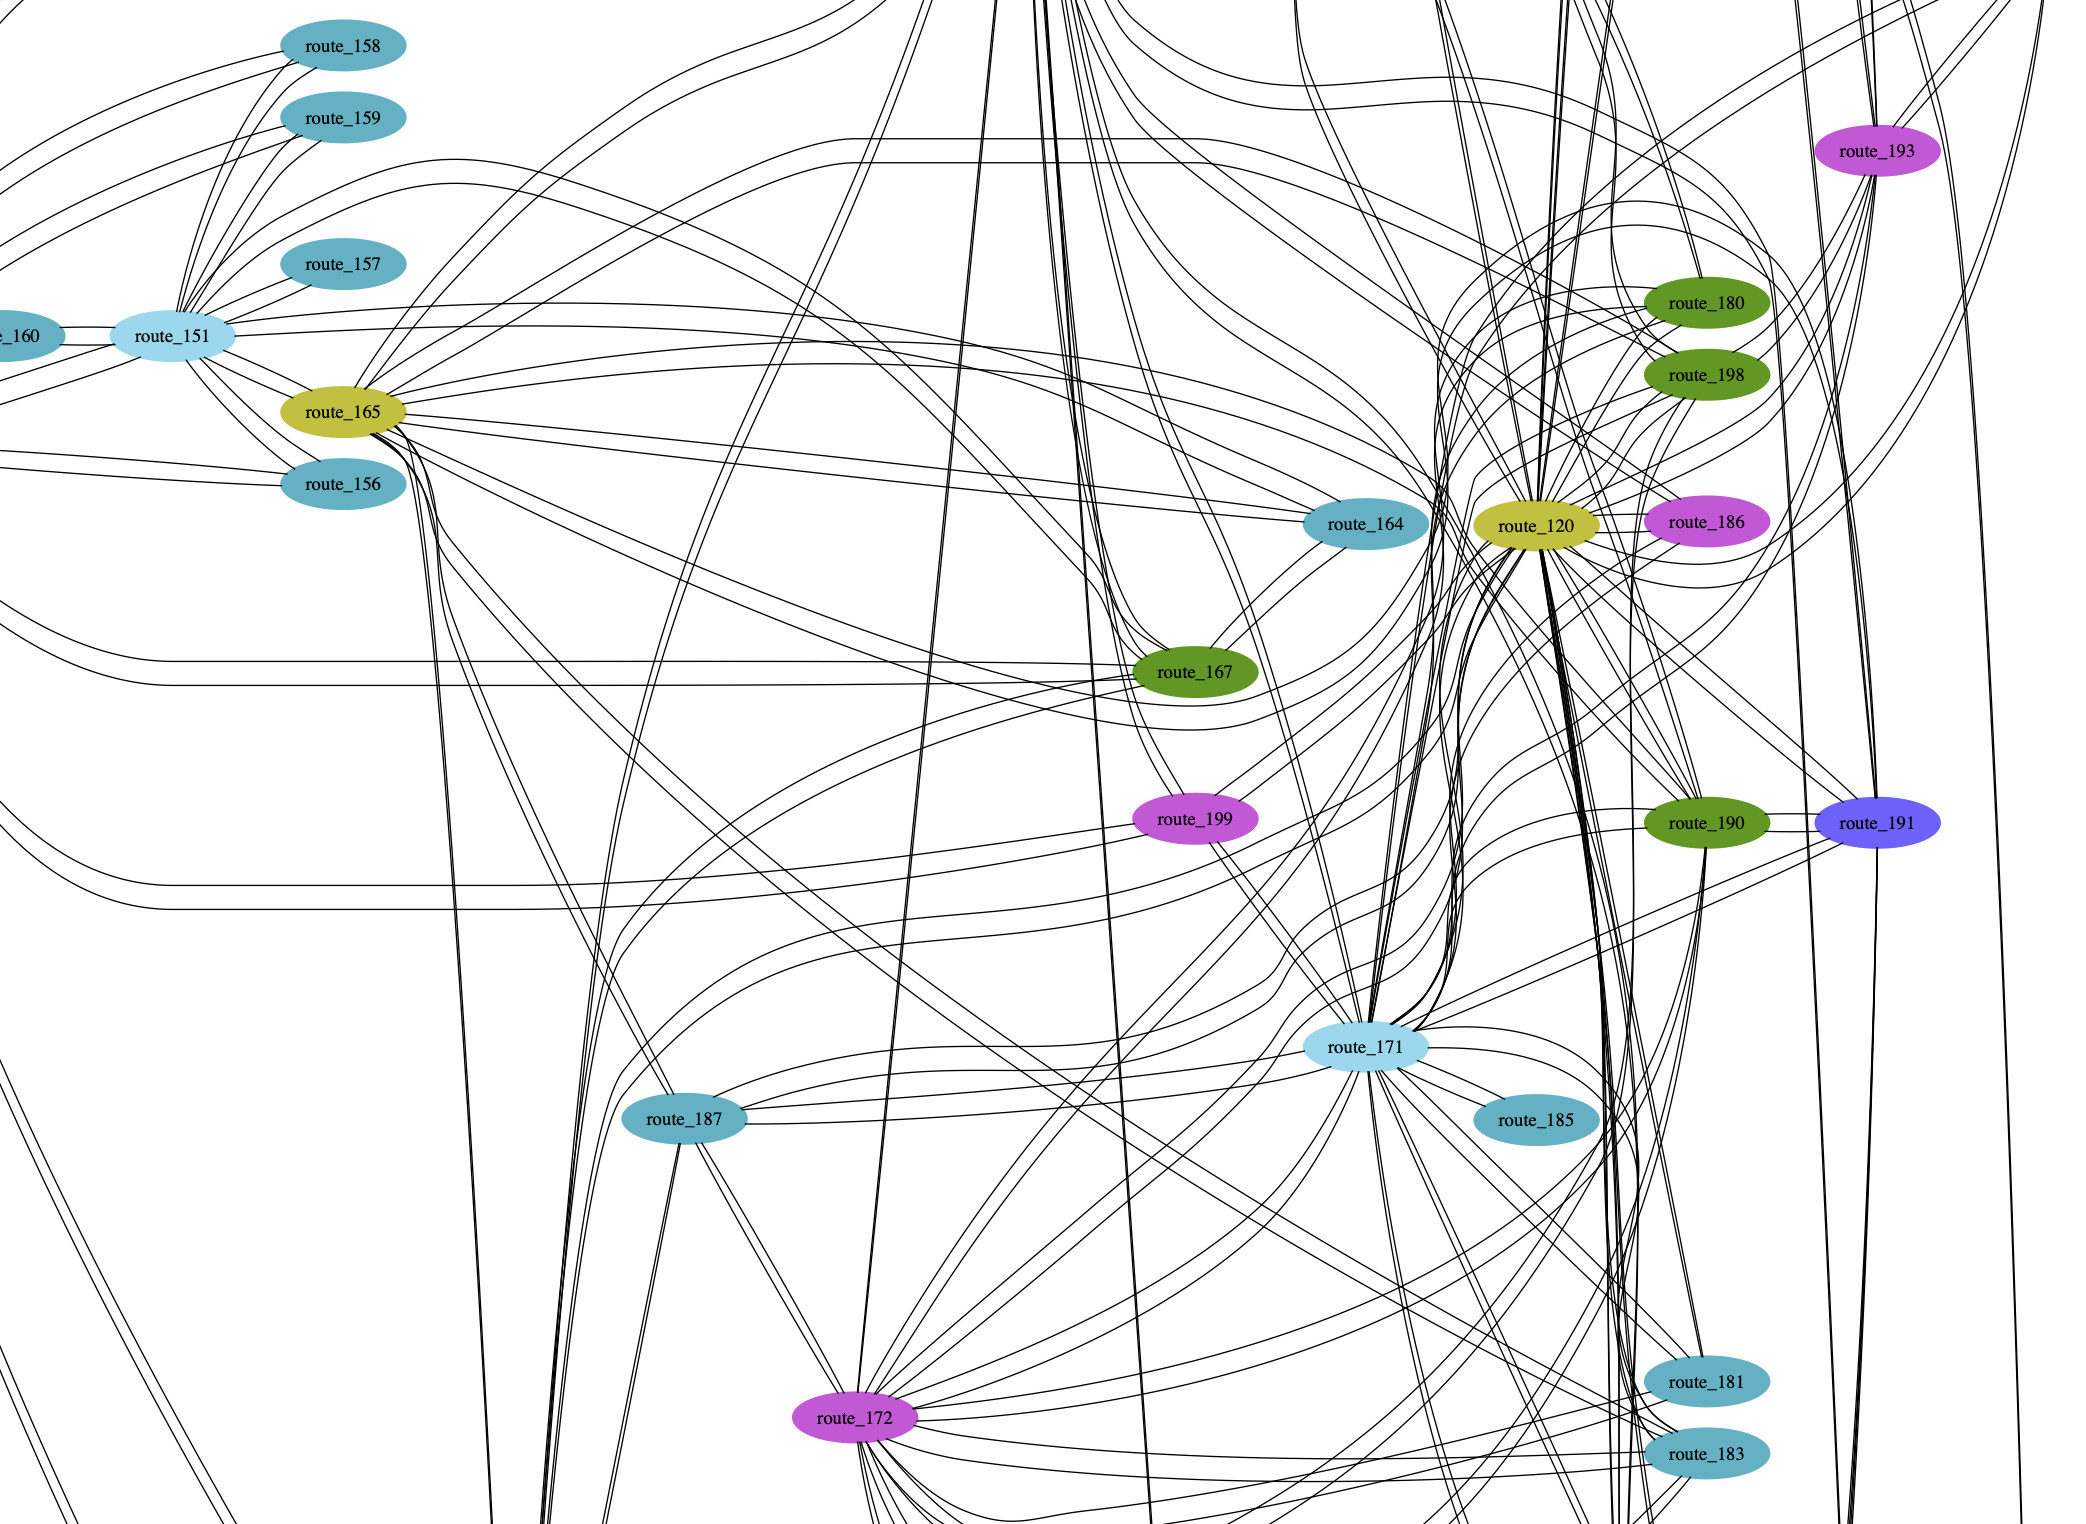
A selection of the NYC MTA subway vertex coloring (See below for more details):
Functions for computing the constraint graph and coloring are in src/color.py and require no external dependencies.
In order to generate png output graphs you will need to install the graphviz library:
pip install -r requirements.txt
Running tests will also output the png graph, this can be done with:
make
Given a limited set of RAPTOR data structures, provide a vertex coloring for the network. Here each Route is a vertex and an edge to another Route exists iff both Routes share a stop.
The output should be a color for each Route.
A test network is defined as follows:
route_1        3
               |
route_0   0 -- 1    2
               |    |
               4    5 - 7  route_3
                    |
route_2             6
The list at index i indicates which routes touch stop_i. Therefore len(routes_for_stops) == # stops.
routes_for_stops: [[0], [0, 1], [2], [1], [1], [2, 3], [2], [3]]
The list at index i indicates which stops are on route_i. Therefore len(stops_for_routes) == # routes.
stops_for_routes: [[0, 1], [3, 1, 4], [2, 5, 6], [5, 7]]
Which routes share stops?
route_0 and route_1
route_2 and route_3
So a possible accurate coloring would be:
route_colors: [0, 1, 0, 1]
The example happens to be bipartite and the example coloring is chromatic, but the input need not be and this algorithm will still handle it correctly.
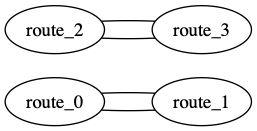
We can visualize the output for the example data above using src/draw.py. The uncolored constraint graph is:
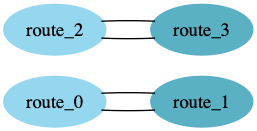
After running the constraint graph through vertex coloring we get:
There are an additional set of utilities provided to process raw agency GTFS and output the vertex coloring. As a demonstration the directory gtfs/ contains NYC MTA subway GTFS data from transitfeeds which can be loaded into a local SQLite database for graph generation.
The processing time for this operation is high due to the size of the MTA network, but should you be interested in generating the graph be patient and run:
make load_and_draw
The MTA subway network only has 30 "GTFS routes", but RAPTOR defines routes differently resulting in 215 routes/vertices in the final network. This creates a very large graph which is hard to visually inspect in its entirety, but if you are interested it is included here: https://github.com/keyan/metro_coloring/blob/master/output/mta_colored.gv.png