In this project, we have designed and developed an interactive dashboard to explore Global Terrorism Database (GTD), which has information of ~180K terrorist events around the world for the years 1970-2017. The dashboard is divided into three main views -
This page explores the time component of the dataset. The user can view the trends in terrorism over time worldwide, for each region and country. The user can further set a year to view the terrorist events that occurred in that particular year on an interactive world map, along with the details of the events. The most affected country or region in each year and the corresponding information on events is combined in this view.
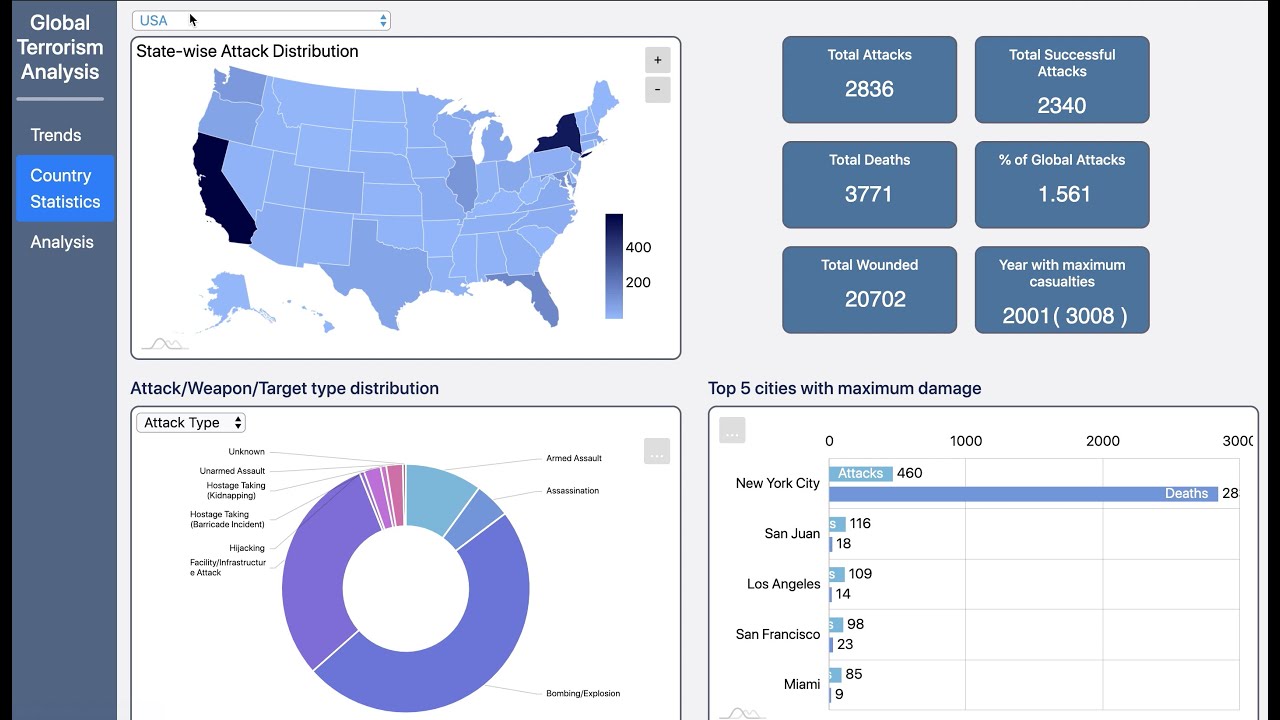
On this page, terrorism statistics of all the countries can be explored. On selecting a country, this page describes the state-wise distribution of terrorism, distribution of attack, target and weapon type, top cities in a country affected by terrorism, and the terrorist organisations responsible for the attacks.
This page provides the aggregate analysis of the entire dataset. Information of activities of top terrorist groups, top deadliest events, attack, target, weapon type distribution, countries most affected by terrorism and motive can be explored here.
Visual representations: Map, Line plot, pie plot, bar chart, Fishbone chart, bubble plot, word cloud, radar timeline.
Interactivity: Zooming, Panning, Hover, Click, Drop down, Sliders, Linking of views
The visualisations have been rendered using the libraries of D3.js and amCharts. The web application is hosted using Flask in python. The level of interactivity is ~1s per action. All the plots can be downloded in the form of image or data. The report details the findings from the visualisation and interaction.
The video of the website can be found here:
Steps to run:
- git clone https://github.com/keya-desai/Global-Terrrorism-Database-Dashboard.git
- cd Terrorism-Analaysis-and-Visualisation
- python dashboard.py
Run : http://127.0.0.1:5000/