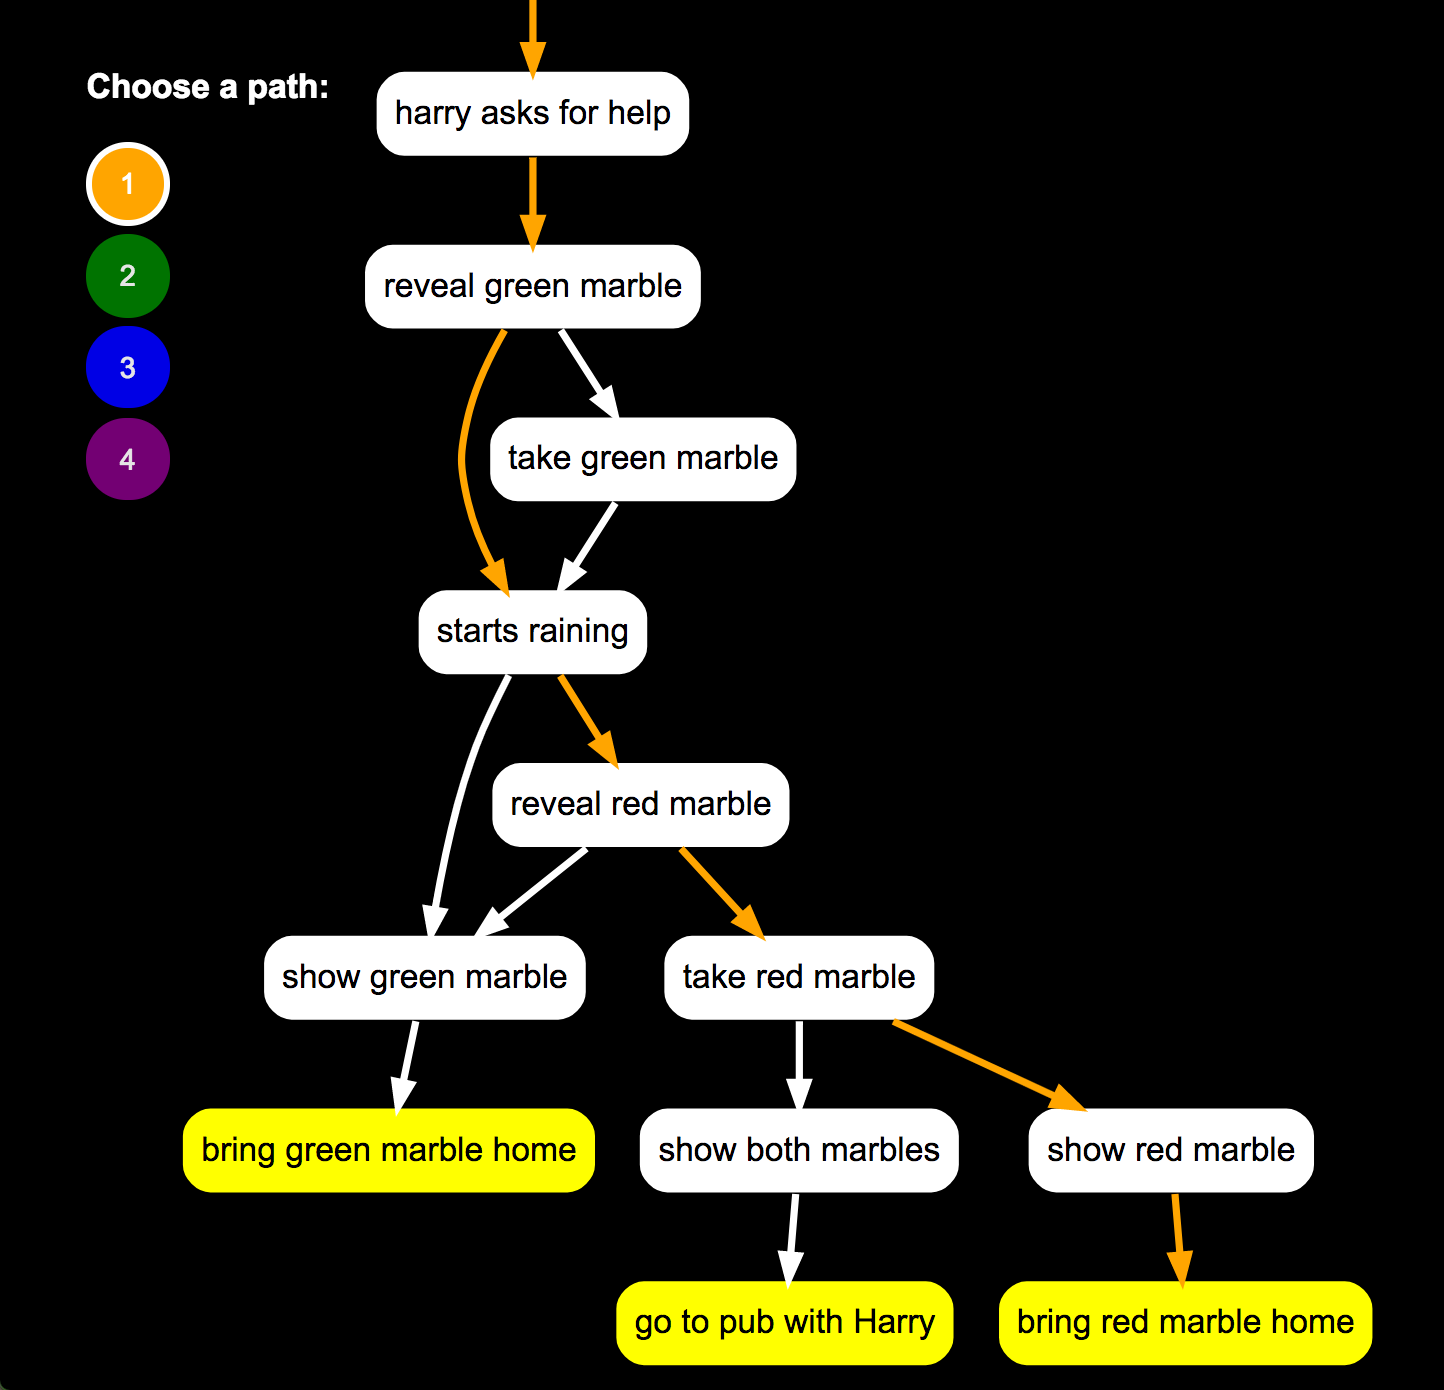
The Elm Narrative Engine is a tool for building interactive stories using a context-based, rule-matching system. This means that stories built with this tool do not follow a "choose your own adventure" style tree shape, but can have multiple, sometimes circling paths through the story.
This tool is an experiment to visually represent the shape and possible paths through these stories. It displays all of the possible paths from beginning to a possible ending, displaying only critical rules that distinguish the path.
First, go play the demo interactive story at http://blog.elmnarrativeengine.com/sample-stories/mystery-of-the-missing-marbles/.
Then, go to https://jschomay.github.io/ene-graph/graph.html to see the graph of that story, and explore all of the possible paths you could have taken.
This was an experiment, which I think was a success. I would like to make it into more of a tool that can help authors as they write interactive stories. If you have some suggestions, make an issue.