The TDA Thread Dump Analyzer for Java is a small Swing GUI for analyzing Thread Dumps and Heap Information generated by the Sun Java VM (currently tested with 1.4.x, 1.5.0_x, 1.6.0_x, 1.7.0_x and 1.8.0_x releases). It parses the thread dumps and class histograms from a provided log file. TDA needs at least Java 1.4.2_x to run.
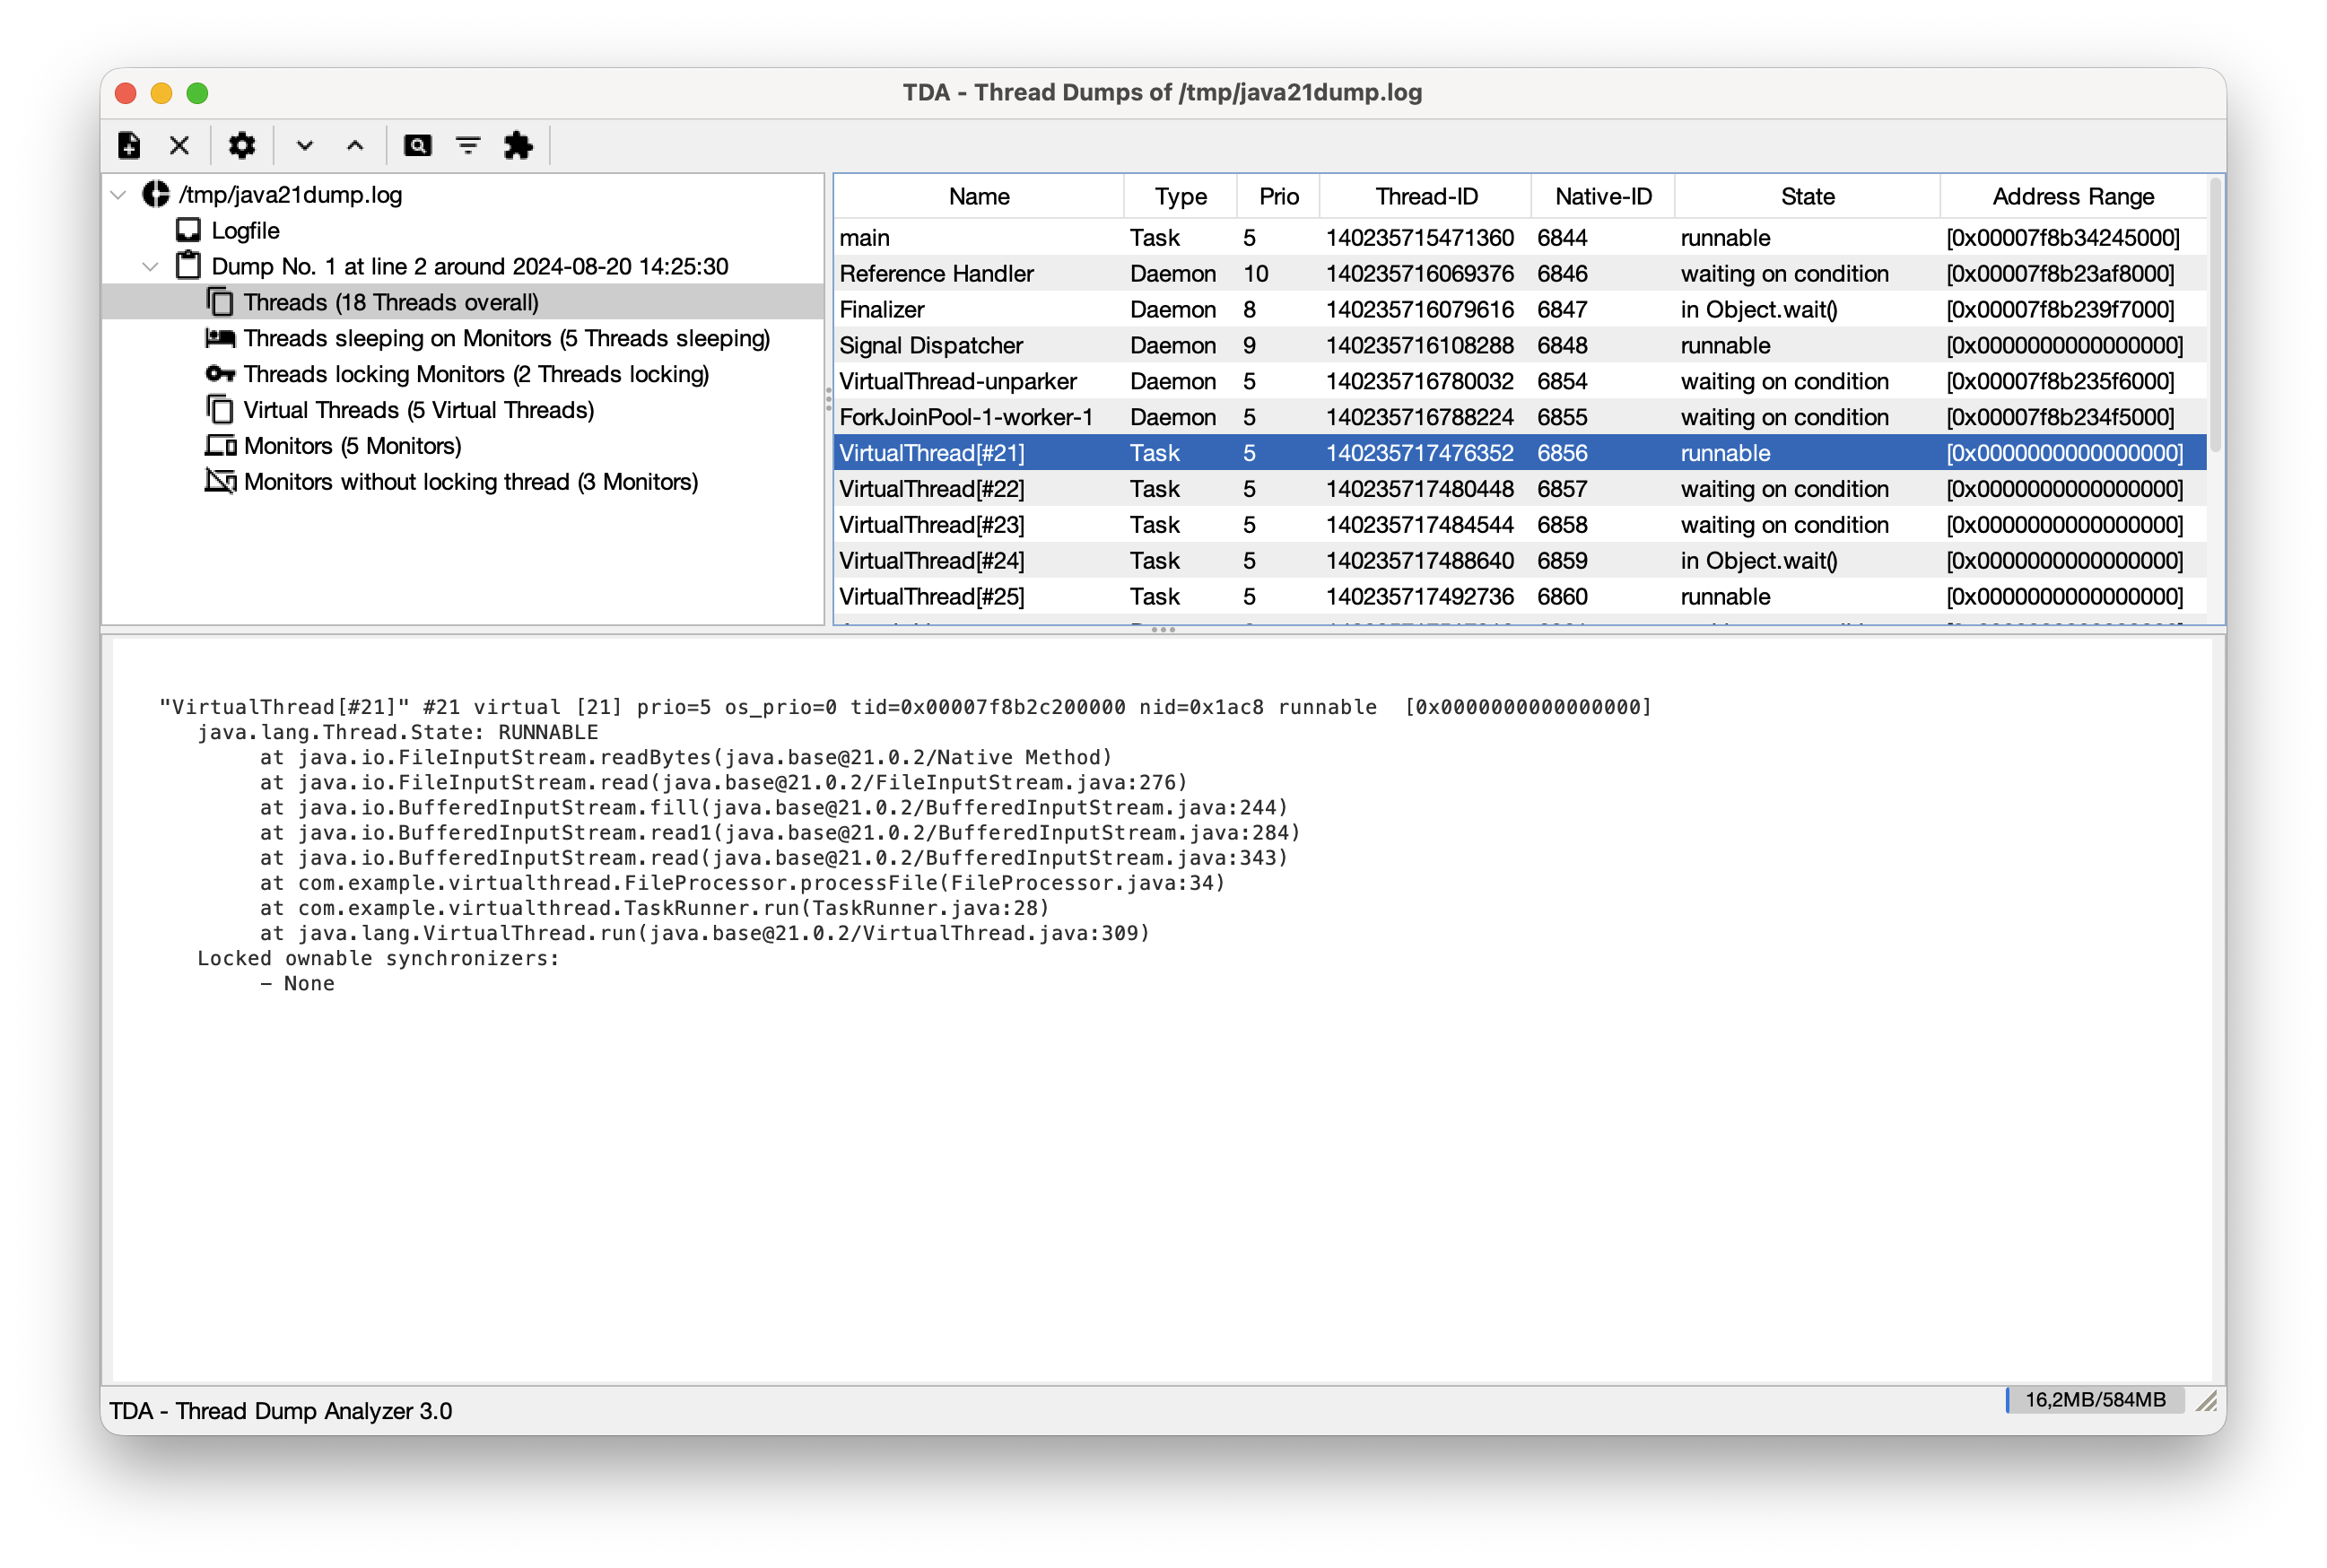
It provides statistic informations about the found thread dumps, gives information about locked monitors and waiting threads. It can diff between threads to look for similarities and has a "long-running-thread" detection. It also provides overview of heap objects at a thread dump, if class histogram was logged.
Features are in detail:
- Parsing all thread dumps of a log file, using a specified regular expression for log file time stamps (thread dumps don't have any date information by default), displaying them in a tree.
- Display of statistic data about the found thread dumps, display of monitors, waiting, sleeping and locking threads, dumps provide links in context for easy dump navigation,
- integrated class histogram analysis for a specific thread dump (using the -XX:+PrintClassHistogram option of the VM), can also be parsed from a second file, if loggc-Option was used (to log garbage collections to a different log file).
- displays deadlock information from the thread dump, displays hints about possible problems in the analyzed dumps and
- ability to add additional logfiles (useful if logfiles are rotated) or open many at once.
- Session handling to be able to reopen a tda session.
- Integration into JConsole as plugin.
- A VisualVM plugin, available through the VisualVM Plugin Center.
The emphasis of the TDA is to provide analysis support of offline information gathered from production environments.
In addition to TDA you might find the GCViewer helpful. It parses the output of the garbage collector from a loggc file and displays it graphically, so you can analyse the memory usage over the time. See here: https://github.com/chewiebug/GCViewer