- How can I copy a section of a packet from a remote machine when I can't forward X11?
- Can I run termshark on MacOS/OSX?
- Can I run termshark on Android?
- If I load a big pcap, termshark doesn't load all the packets at once - why?
- Termshark is too bright!
- Termshark's colors are wrong!
- What settings affect termshark's colors?
- How do I rebuild termshark?
- Where are the config and log files?
- I'm capturing with tcpdump. Can termshark treat that pcap like a live capture?
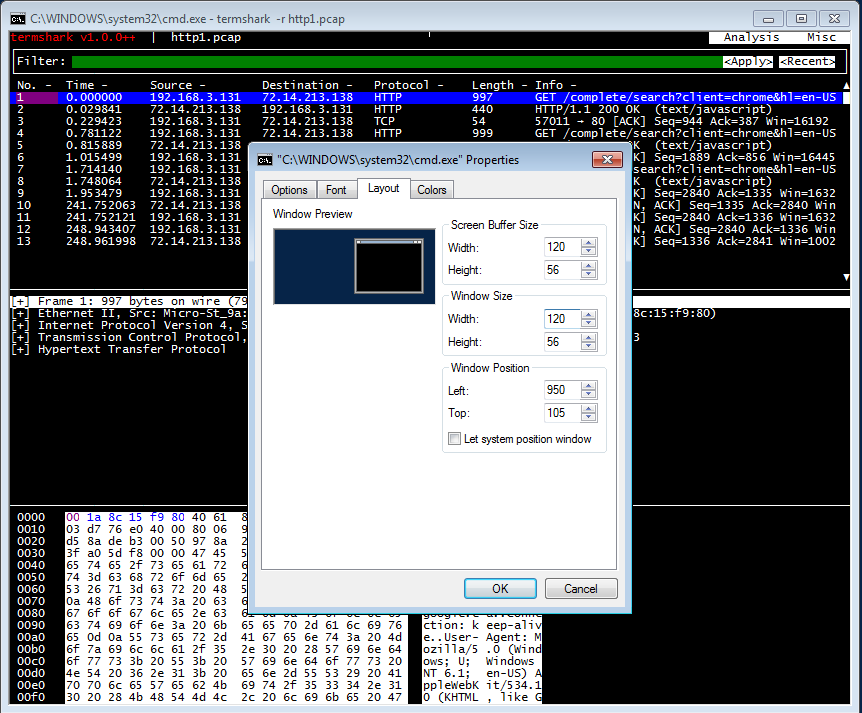
- The console is too narrow on Windows
- Can I pass extra arguments to tshark?
- How does termshark use tshark?
- How can I make termshark run without root?
- Why is termshark generating traffic on port 5037?
- How can termshark capture from extcap interfaces with dumpcap?
- Termshark is laggy or using a lot of RAM
- Termshark is using lots of disk space
- How much memory does termshark use?
- What is the oldest supported version of tshark?
- What's next?
You can set up a custom termshark copy command that sends the copied data to a pastebin service, for example. If your remote machine is Ubuntu, try making an executable script called e.g. /usr/local/bin/ts-copy.sh
#!/bin/bash
echo -n "See " && pastebinit
Then edit ~/.config/termshark/termshark.toml and set
[main]
  copy-command = "/usr/local/bin/ts-copy.sh"
When you copy a section of a packet, you should see something like this:

Yes, you can install it from Homebrew.
brew update
brew install termshark
You can see the formula here.
Yes, termshark is now packaged for Termux in the root-repo repository. Here's how to get it running:
- Install Termux and Termux:API through the Google Play Store. Termux:API is needed for access to Android's clipboard, in case you want to use termshark to copy sections of packets.
- Run termux and type
pkg install root-repo
pkg install termux-api
pkg install termshark
You can also add a termshark widget to your home screen using the Termux:Widget app. If you launch termshark from the widget, termshark will open a file picker to let you select a pcap to inspect (e.g. one you've downloaded). To make termshark available via a termux widget, do something like this in your termux home directory after installing termshark:
mkdir .shortcuts
cd .shortcuts
ln -s $(which termshark)
Termshark cheats. When you give it a pcap, it generates PSML XML for every packet, but not the complete PDML (packet structure) XML. If you run time tshark -T pdml -r huge.pcap > /dev/null you'll see it can take many minutes to complete. So rather than generating PDML for the entire pcap file, termshark generates PDML in 1000 packet chunks (by default). It will always prioritize packets that are in view or could soon be in view, so that the user isn't kept waiting. Now, if you open a large pcap, and - once the packet list is complete - hit end, you would want to be able to see the structure of packets at the end of the pcap. If termshark generated the PDML in one shot, the user could be kept waiting many minutes to see the end, while tshark chugs through the file emitting data. So to display the data more quickly, termshark runs something like
tshark -T pdml -r huge.pcap -Y 'frame.number >= 12340000 and frame.number < 12341000'tshark is able to seek through the pcap much more quickly when it doesn't have to generate PDML - so this results in termshark getting data back to the user much more rapidly.
If you start to page up quickly, you will likely approach a range of packets that termshark hasn't loaded, and it will have to issue another tshark command to fetch the data. Termshark launches the tshark command before those unloaded packets come into view but there's room here for more sophistication. One problem with this approach is that if you sort the packet list by a field like source IP, then moving up or down one packet may result in needing to display the structure and bytes for a packet many thousands of packets away from the current one ordered by time - so termshark might kick off a new -T pdml command for each up or down movement, meaning termshark will continually display "Loading..."
Termshark v2 supports dark-mode! Hit Esc to bring up the main menu then "Toggle Dark Mode". See the User Guide. As of termshark v2.4, dark-mode is the default.
See this answer.
If termshark's background is a strange color like dark blue or orange, maybe a tool like base16-shell has remapped some of the colors in the
256-color-space, but termshark is unaware of this. Try setting this in termshark.toml:
[main]
ignore-base16-colors = trueUnfortunately there are several :-/
First of all, your terminal emulator's TERM variable determines the range of colors available to termshark e.g. xterm-16color, xterm-256color.
If you also have COLORTERM=truecolor set, and the terminal emulator has support, 24-bit color will be available. Termshark will emit these 24-bit
ANSI color codes and color should be faithfully reproduced.
You can override the value of TERM with termshark's main.term setting in termshark.toml e.g.
[main]
  term = "screen-256color"
When termshark runs, it will load your selected theme if it's available in the terminal's color mode. If not, it will choose the built-in default
theme which is available in every mode. If you run in truecolor mode, and your chosen theme is only defined for 256-colors, termshark will load the
256-color theme.
Termshark will load its theme from ~/.config/termshark/themes/ if it can find it, otherwise it will look in its built-in database. Termshark has
themes called default, dracula, solarized and base16 built-in.
If you are using base16-shell, then you might have colors 0-21 of your terminal's 256-color-space
remapped. If you are running in 256-color mode, and your theme specifies RGB colors, termshark will choose the closest match among those in the
256-color-space. Termshark will ignore colors 0-21 as match candidates if BASE16_SHELL is set in the environment. It will also ignore these colors
if you set main.ignore-base16-colors in termshark.toml. Otherwise, termshark will assume colors 0-21 are displayed "normally", and may pick these
remapped colors as the closest match to a theme's color - resulting in incorrect colors.
If you don't have the source, clone it like this:
$ git clone https://github.com/gcla/termsharkYou'll get best results with the latest version of Golang - 1.15 as I write this - but anything >= 1.12 will work.
Set your environment:
$ export GO111MODULE=onChange to the termshark dir and type
$ go generate ./...
$ go install ./...
The generate step is only necessary if you have changed any files under termshark/assets/themes/. If not, just run
$ go install ./...Termshark will be installed as ~/go/bin/termshark.
You can find the config file, termshark.toml, in:
${XDG_CONFIG_HOME}/termshark/(${HOME}/.config/termshark/)on Linux${HOME}/Library/Application Support/termshark/on macOS%APPDATA%\termshark\(C:\Users\<User>\AppData\Roaming\termshark\)on Windows
You can find the log file, termshark.log, in:
${XDG_CACHE_HOME}/termshark/(${HOME}/.cache//termshark/)on Linux${HOME}/Library/Caches/termshark/on macOS%LOCALAPPDATA%\termshark\(C:\Users\<User>\AppData\Local\termshark\)on Windows
Yes, at least on Unix systems. Try this:
shell1$ tcpdump -i eth0 -w foo.pcap
shell2$ tail -f -c +0 foo.pcap | termsharkUnfortunately, the standard console window won't let you increase its size beyond its initial bounds using the mouse. To work around this, after termshark starts, right-click on the window title and select "Properties". Click "Layout" and then adjust the "Window Size" settings. When you quit termshark, your console window will be restored to its original size.
Yes, via ~/.config/termshark/termshark.toml. Here is an example I use:
[main]
tshark-args = ["-d","udp.port==2075,cflow","-d","udp.port==9191,cflow","-d","udp.port==2055,cflow","-d","udp.port==2095,cflow"]Termshark uses tshark to provide all the data it displays, and to validate display filter expressions. When you give termshark a pcap file, it will run
tshark -T psml -r my.pcap -Y '<expression from ui>' -o gui.column.format:"..."```The data provided to the gui.column.format tshark argument is stored in termshark's config file under the key main.column-format. Let's say the
user is focused on packet number 1234. Then termshark will load packet structure and hex/byte data using commands like:
tshark -T pdml -r my.pcap -Y '<expression from ui> and frame.number >= 1000 and frame.number < 2000'
tshark -F pcap -r my.pcap -Y '<expression from ui> and frame.number >= 1000 and frame.number < 2000' -w -
If the user is reading from an interface, some extra processes are needed. To capture the data, termshark runs
dumpcap -P -i eth0 -f <capture filter> -w <tmpfile>This process runs until the user hits ctrl-c or clicks the "Stop" button in the UI. The path to tmpfile is printed out to the user when termshark exits. Then to feed data continually to termshark, another process is started:
tail -f -c +0 tmpfileThe stdout of the tail command is connected to the stdin of the PSML reading command, which is adjusted to:
tshark -T psml -i - -l -Y '<expression from ui>' -o gui.column.format:"..."```The -l switch might push the data to the UI more quickly... The PDML and byte/hex generating commands read directly from tmpfile, since they don't need to provide continual updates (they load data in batches as the user moves around).
When the user types in termshark's display filter widget, termshark issues the following command for each change:
tshark -Y '<expression from ui>' -r empty.pcapand checks the return code of the process. If it's zero, termshark assumes the filter expression is valid, and turns the widget green. If the return code is non-zero, termshark assumes the expression is invalid and turns the widget red. The file empty.pcap is generated once on startup and cached in $XDG_CACHE_HOME/termshark/empty.pcap (on Linux, ~/.cache/termshark/empty.pcap) On slower systems like the Raspberry Pi, you might see this widget go orange for a couple of seconds while termshark waits for tshark to finish.
If the user selects the "Analysis -> Reassemble stream" menu option, termshark starts two more tshark processes to gather the data to display. First, tshark is invoked with the '-z' option to generate the reassembled stream information. Termshark knows the protocol and stream index to supply to tshark because it saves this information when processing the PDML to populate the packet structure view:
tshark -r my.pcap -q -z follow,tcp,raw,15This means "follow TCP stream number 15". The output will look something like:
===================================================================
Follow: tcp,raw
Filter: tcp.stream eq 15
Node 0: 192.168.0.114:1137
Node 1: 192.168.0.193:21
        3232302043687269732053616e6465727320465450205365727665720d0a
55534552206373616e646572730d0a
        3333312050617373776f726420726571756972656420666f72206373616e646572732e0d0a
...
A second tshark process is started concurrently:
tshark -T pdml -r my.pcap -Y "tcp.stream eq 15"The output of that is parsed to build an array mapping the index of each "chunk" of the stream (e.g. above, 0 is "3232", 1 is "5553", 2 is "3333") to the index of the corresponding packet. This is not always x->x because the stream payloads for some packets are of zero length and are not represented in the output from the first tshark '-z' process. The mapping is used when the user clicks on a chunk of the reassembled stream in the UI - termshark will then change focus behind the scenes to the corresponding packet in the packet list view. If you exit the stream reassembly UI, you can see the newly selected packet.
When termshark starts these stream reassembly processes, it also sets a display filter in the main UI e.g. "tcp.stream eq 15". This causes termshark to invoke the PSML and PDML processes again - in addition to the two stream-reassembly-specific processes that I've just described.
If the user selects "Analysis -> Conversations" from the menu, termshark starts a tshark process to gather this information. If the configured conversation types are eth, ip, tcp, then the invocation will look like:
tshark -r my.pcap -q -z conv,eth -z conv,ip -z conv,tcpThe information is displayed in a table by conversation type. If the user has a display filter active - e.g. http - and hits the "Limit to filter" checkbox, then tshark will be invoked like this:
tshark -r my.pcap -q -z conv,eth,http -z conv,ip,http -z conv,tcp,httpIf the user runs a packet search and chooses the Display Filter option, termshark will launch a tshark process to find packets that match the filter.
tshark -T psml -r my.pcap -Y '<search expression from ui>' -o gui.column.format:"No.","%m"```If the user has an active display filter via the UI, it is combined with the search expression:
tshark -T psml -r my.pcap -Y '(<display filter from ui>) && (<search expression from ui>)' -o gui.column.format:"No.","%m"```Termshark also uses tshark to generate the possible completions for prefixes of display filter terms. If you type tcp. in the filter widget, termshark will show a drop-down menu of possible completions. This is generated once at startup by running
tshark -G fieldsthen parsing the output into a nested collection of Go maps, and serializing it to $XDG_CACHE_HOME/termshark/tsharkfieldsv3.gob.gz.
If the user creates a new termshark profile, an option is provided to link to a Wireshark profile. To gather a list of these profiles, termshark runs
tshark -G foldersand parses out the global and personal configuration directories.
Finally, termshark runs tshark to generate the list of all valid columns and their names. These are used to populate a dropdown menu showing valid column choices when the user configures their column set. Termshark runs
tshark -G column-formatsand serializes this list to $XDG_CACHE_HOME/termshark/tsharkcolumnsv2.gob.gz.
Termshark also uses the capinfos binary to compute the information displayed via the menu "Analysis -> Capture file properties". capinfos is typically distributed with tshark.
Termshark depends on tshark, and termshark will run without root if tshark/dumpcap will. On Linux, these are the most common ways to allow tshark to run as a non-root user
- For Ubuntu/Debian systems, you can add your user to the
wiresharkgroup. These instructions are taken from this answer on wireshark.org:
sudo apt-get install wireshark
sudo dpkg-reconfigure wireshark-common
sudo usermod -a -G wireshark $USER
newgrp wireshark
If you logout and login again after usermod, you can omit the newgrp command.
- You might need to set the capabilities of
dumpcapusing a command like this:
sudo setcap cap_net_raw,cap_net_admin+eip /usr/sbin/dumpcapYou can find more detail at https://wiki.wireshark.org/CaptureSetup/CapturePrivileges.
See this issue.
TL;DR - try deleting /usr/lib/wireshark/extcap/androiddump.
Termshark doesn't always capture using dumpcap. It will try to use dumpcap if
possible, because testing (from @pocc) indicated that it is less likely to
drop packets - presumably because dumpcap's job is limited to generating a
pcap with little interpretation of data. However, dumpcap doesn't support
extcap interfaces like randpkt. If termshark detects that the live capture
device is an extcap interface, it will use tshark as the capture binary
instead. It does this automatically by using termshark itself as the default
capture-command, and to make this work, termshark now runs the capture
command with the environment variable TERMSHARK_CAPTURE_MODE set. dumpcap
and tshark will ignore that, but termshark will detect it at startup and
switch immediately to capture mode. It then runs this, in pseudo-code form`:
cmd := exec.Command(dumpcap, args...)
if cmd.Run() != nil {
   syscall.Exec(tshark, append([]string{tshark}, args...), os.Environ())
}
This trick is only implemented for Unix OSes. On Windows, termshark will use
dumpcap. If you need to read extcap interfaces on Windows, you can set
capture-command to tshark in the toml config file.
I hope this is much-improved with v2. If you still experience problems, try running termshark with the --debug flag e.g.
termshark --debug -r foo.pcapYou can then generate a CPU profile with
pkill -SIGUSR1 termsharkor a heap/memory profile with
pkill -SIGUSR2 termsharkThe profiles are stored under $XDG_CACHE_HOME/termshark (e.g. ~/.cache/termshark/). You can investigate with go tool pprof like this:
go tool pprof -http=:6061 $(which termshark) ~/.cache/termshark/mem-20190929122218.profand then navigate to http://127.0.0.1:6061/ui/ (or remote IP) - or open a termshark issue and upload the profile for us to check :-)
There will also be a debug web server running at http://127.0.0.1:6060/debug/pprof (or rmote IP) from where you can see running goroutines and other information.
By default, termshark saves live captures in ${XDG_CACHE_HOME}/termshark/pcaps. Over time, this directory can grow very large. If you do not need
these captures, you can safely delete the directory. Termshark v2.3 and above provides a config option to control the growth of this directory e.g.
[main]
  disk-cache-size-mb = 100
If this setting is active and not -1, shortly after startup, termshark will check the directory and if it is too large, delete files, oldest first, to bring its size within the configured limit.
Termshark v2.3 and above will also let you choose, prior to exiting, whether or not you want to keep the pcap of the current live capture. You can
also invoke termshark with the -w flag to choose where the live capture pcap is written.
It's hard to be precise, but I can provide some rough numbers. Termshark uses memory for two things:
- for each packet in the whole pcap, a subsection of the PSML (XML) for that packet
- in groups of 1000 (by default), loaded on demand, a subsection of the PDML (XML) for each packet in the group.
See this question for more information on the on-demand loading.
Using a sequence of pcaps with respectively 100000, 200000, 300000 and 400000 packets, I can see termshark v2 (on linux) adds about 100 MB of VM space and about 50MB of RSS (resident set size) per 100000 packets - with only PSML loaded. As you scroll through the pcap, each 1000 packet boundary causes a load of 1000 PDML elements from tshark. Each extra 1000 packets increases RSS by about 30MB. This is about an 80% improvement over termshark v1 - accomplished by simply compressing the serialized representation in RAM.
As much as possible, I want termshark to work "right out of the box", and to me that meant not requiring the user to have to update tshark. On Linux I have successfully tested termshark with tshark versions back to git tag v1.11.0; but v1.10.0 failed to display the hex view. I didn't debug further. So v1.11.0 is the oldest supported version of tshark. Wireshark v1.11.0 was released in October 2013.
As I write this, I'm about to release termshark v2.4. Here's what might come in v2.5 and beyond:
- Built-in support for editing packet color profiles
- Expose many more of tshark's
-zoptions - HTTP statistics and Wireshark's I/O graph
- Allow the user to start reading from available interfaces once the UI has started
- Anything you raise on Github issues - let me know what features you'd like!