Repository for the scripts created during the Work Package 2.1 of the Euro-Argo RISE project.
A. Plot fleet configuration values (CONFIG_fleet_status.m)
Script description:
Plots the status of a list of floats regarding a configuration parameter and splitting the results depending on the country, deployment date and float model
3 outputs produced:
-
Figure1: config param changed? (How many times a float changed the configuration parameter entered as an input after deployment)
-
Figure2: config param value for floats which did not change configuration (Values taken by the parameter for float that did not change config after deployment; per number of floats)
-
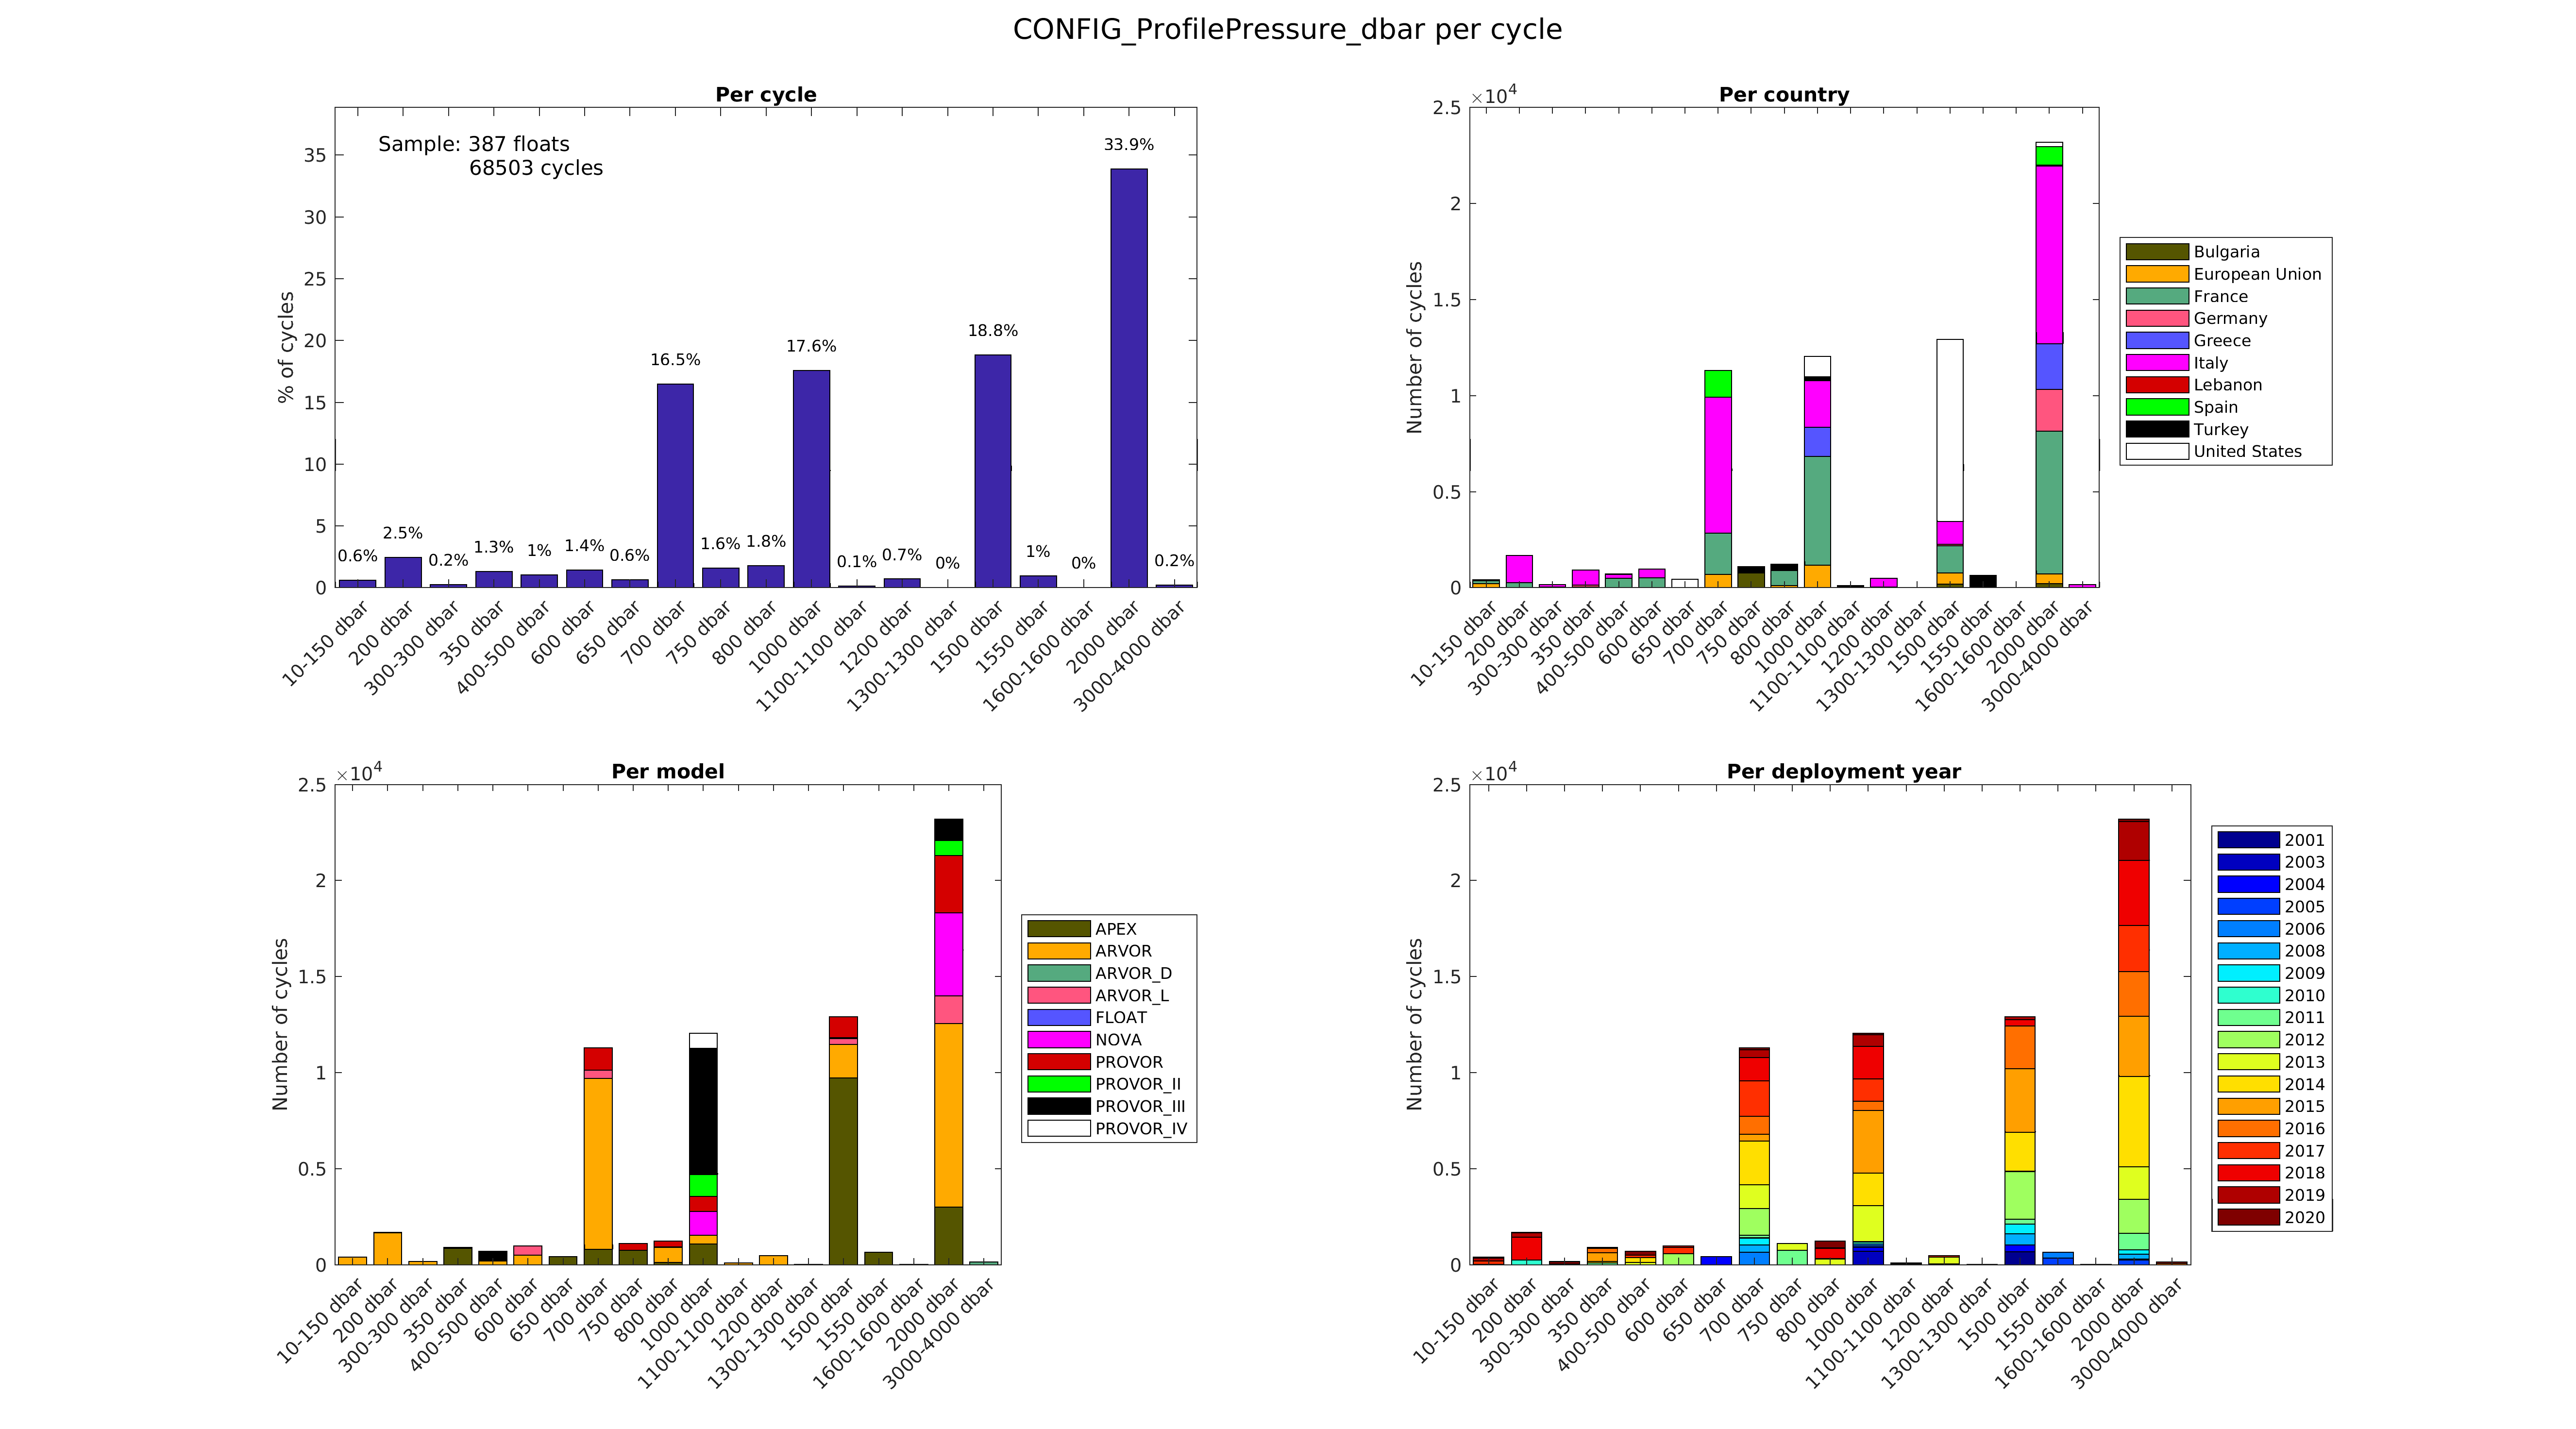
Figure3: config param value per cycle (same as above but expressed in terms of number of cycles).
Output Figure 3 is presented hereafter:

B. Mapping of the technical parameters (map_tech_param.m)
Script description:
Plot a scatter of a tech, traj or config parameter in a map (lon, lat) using a threshold:
-
colormap_thres: if 'above', colormap is use for points above threshold. If 'under', colormap is use for points under threshold.
-
grounded: if 'yes', it plots grounded cycles, if 'no', it does not plot grounded cycles. It only works for ARVOR floats (since the grounding flags on Apex floats are only recorded since the APF11).
NOTES:
(1) Depending on the number of floats, the script will take some minutes
(2) If there is only one float in input list, trajectory lines are plotted.
(3) Be careful with RAM memory. If you use so many floats the program can run out of memory.
3 outputs produced: -
Text : data_(paramname)(threshold)(date).txt file : contains a list of floats above or under threshold, cycles above or under threshold and minimun and maximun technical values for each float
-
CSV: qgis_(paramname)(threshold)(date).csv file(if QGIS_csv = 'yes'): ".csv" file with data easy to use in qgis for reproducing the same figure
-
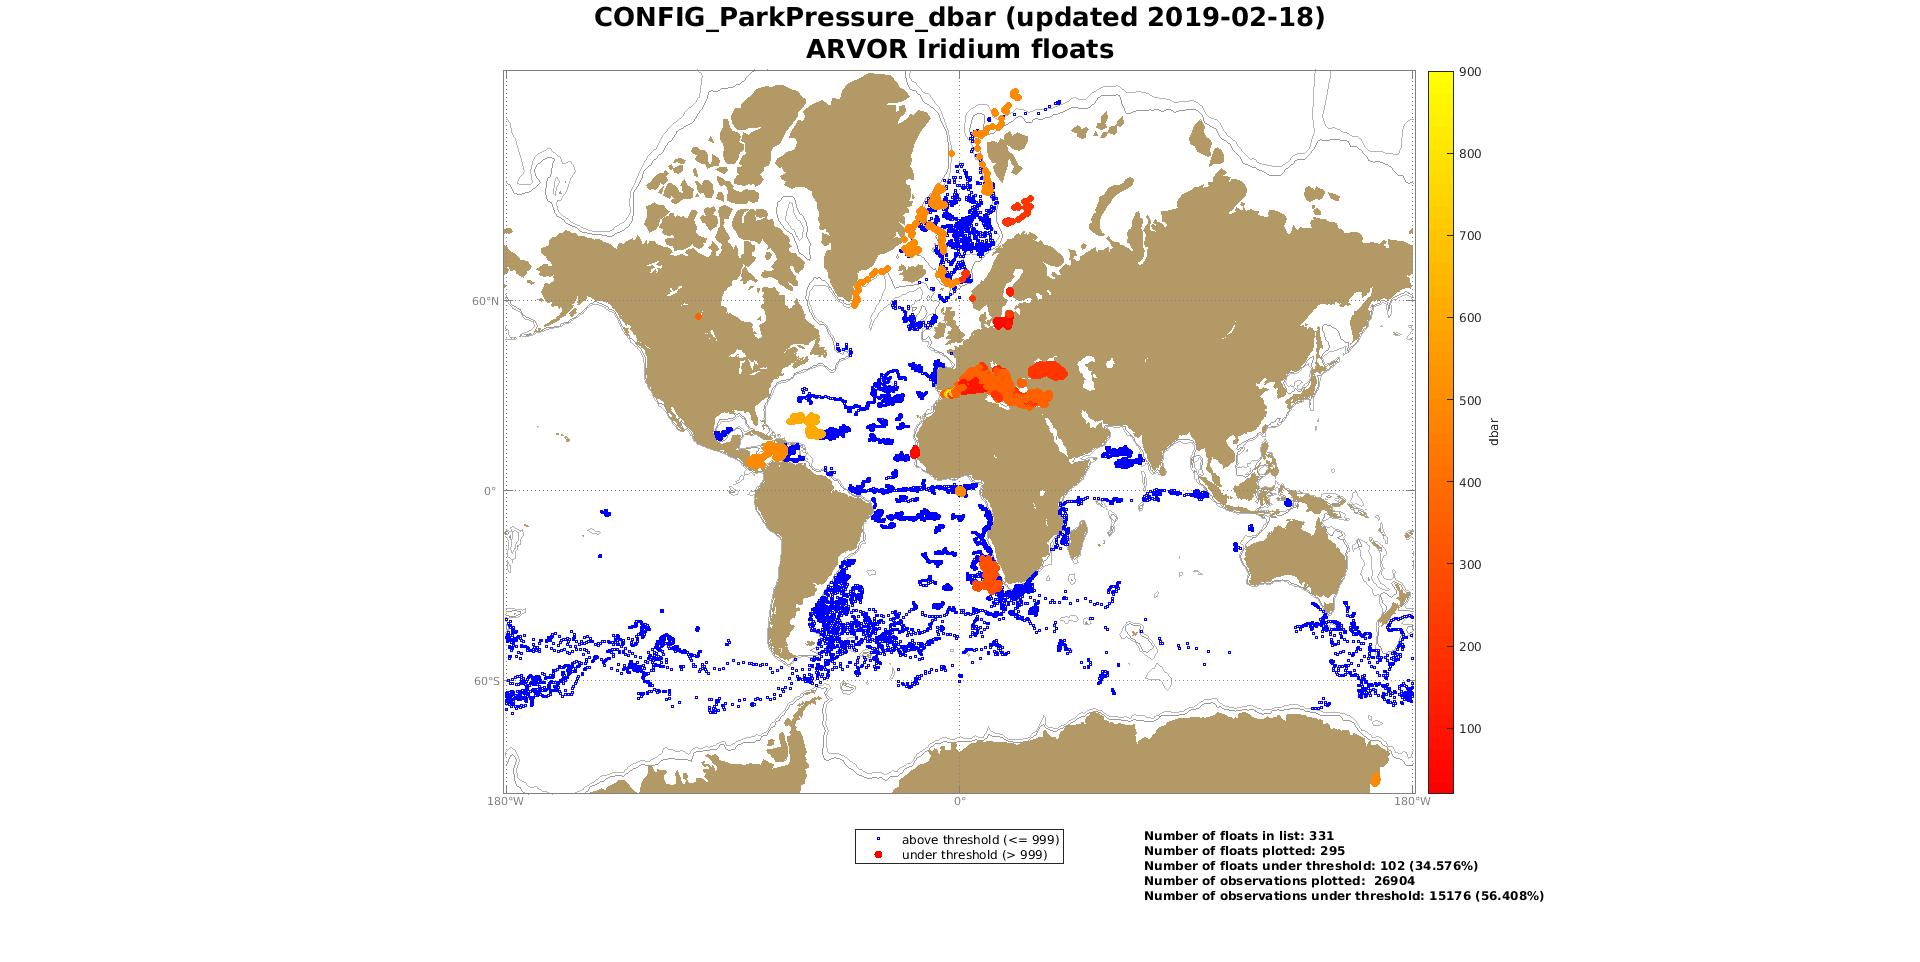
Figure: Scatter of the floats last position colored with a colorbar representing the value taken by the parameter entered as input (figure shown below)

C. Compute survival rates (Compute_survival_rates.m)
Script description:
This script compute the survival rates of a given list of floats, according to the number of cycles made, the vertical_km traveled and the float age.
The matrices of the resulting survival rate computing are then saved as ".mat" file in the export folder specified at the beginning of the script.
Outputs produced:
Matrices: Matrices of the computed survival rates for the list of floats provided as input. These ".mat" file are then used in the "Plot_survival_rates.m" script presented hereafter.
D. Plot survival rates (Plot_survival_rates.m)
Script description:
This script permits to plot different survival rates computations stored as variables (.mat). It permits comparison between different floats samples, models, etc.
The survival rates are computed according to different x-axis: number of cycles, float age and vertical distance traveled (in km)
3 outputs provided:
-
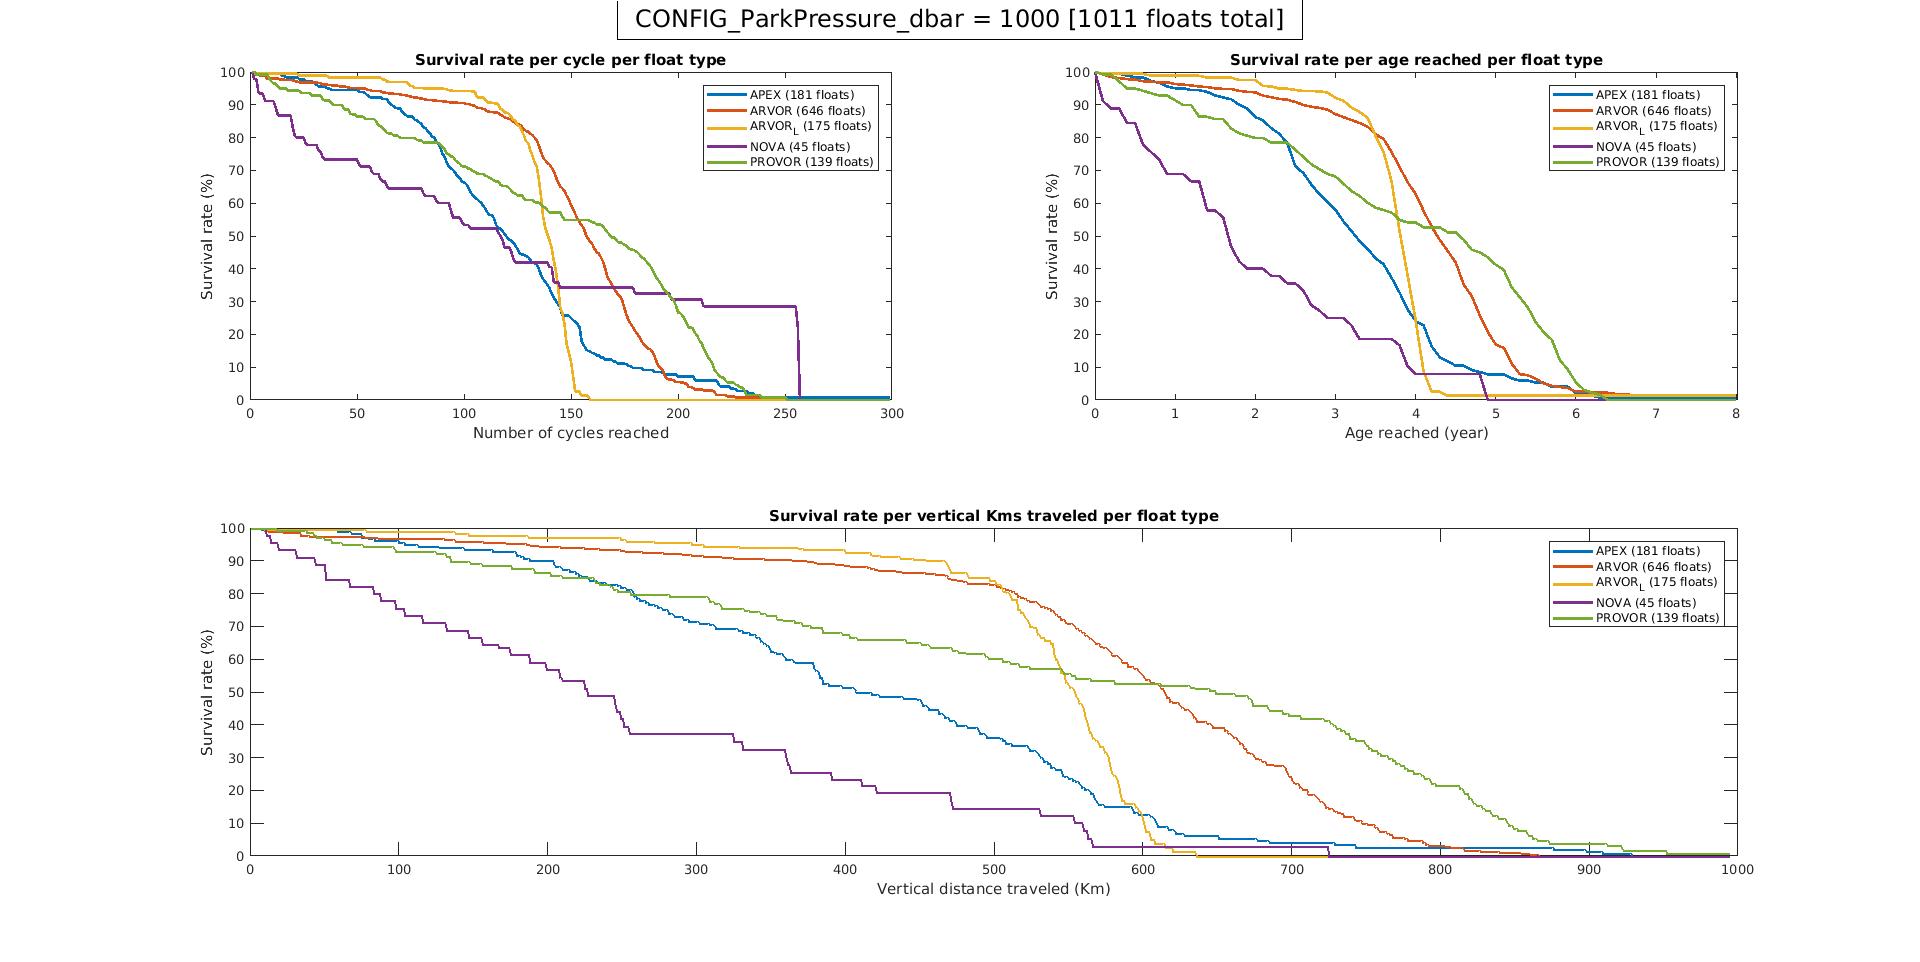
Figure 1: Same as above. X-axis is the vertical distance traveled (in kms).
-
Figure 2: Survival rates divised per models, plotted from the ".mat" file provided in input. X-axis is the float age.
-
Figure 3: Same as above. X-axis is the cycles number made.
Herafter is presented an example of the Figure 1 output for a specific float model (Arvor-I) in different deployment regions.

E. Plot survival rates related to config and/or tech parameters (Survival_rates_config_tech_parameters.m)

Script description:
Plots survival rates depending on a specific configuration parameter values (given in number of cycles, vertical_km and float age). This script takes as an input a WMOs list and the name of the parameter to investigate (either CONFIG or TECH).
NOTES:
(1) Using as input config_param = {'CONFIG_CTDPoints_NUMBER'} the script calculates the number of theoretical CTD points per profile using the function calculate_CTDPoints
(2) Multiple red messages by come up in the prompt windows saying that the variable was not found. It is normal, the variable in question is a cycle number index which might be named differently for another float type than ARVOR.
(3) Possibility to fix a sample size limit (min recommended=10 floats). Computing a survival rate for a smaller sample than that would not be very reliable as one float would could have a huge impact on the resulting survival rate curve and not represent a general trend of the sample.
xx output:
A few popup windows will appear when executing the script. The firs will "only" give some basic informations about the sample and the number of floats/cycles loaded with the desired parameter.
Then in function
F. Groundings repartition (Map_groundings.m)
Script description:
The script was developed in order to provides some discussing materials for the WP6 (Marginal Seas focus) of the EA RISE project. It was then used in the WP2.1 report to represent the impact of the groundings on the life expectancy of a float sample and to help quantify it.
Description of the script:
-
This script aims to plot on a map the different types of groundings flags per cycle according to a WMO list furnished in the input.
-
Groundings flags are stored in the traj files of a float. It can take either:
- Y= Cycle DID ground;
- N= Cycle did NOT ground;
- U= Unknown (corresponds mainly to floats that do not store this information. In the European case, mostly Apex floats before APF11 version);
- Y= Cycle DID ground;
-
You can either put a WMOs list as an input or just a single WMO number
NOTES:
(1) One of the “difficulties” of the script was to convert a variable from the N-cycle dimension to the N-measurements one. The cycle number and latitude/longitude variables are following the N-measurements dimension and the grounding flags are following the N-cycle dimension.
The variable “Cycle_nb_INDEX” stored in the traj file permits to link the two dimensions, following a few steps presented throughout the script.
3 outputs produced: -
Figure 1: A statistical repartition of the grounding’s flag for the WMOs list provided as input
-
Figure 2: A geographical repartition of these flags (map using lat/lon of each cycle once at surface after ascent.)
-
Figure 3: A geographical repartition of the flags per WMOs to permit a specific float tracking.
The figure below presents an example of the output Figure 2: repartition of the grounded cycles for European floats deployed in the Mediterranean Basin.

TOOLBOX

Name & Description of the auxiliary functions used in the different scripts presented above:
- read_csv: read a csv file and generates an struct with file variables
- get_floats_filepath: gets files paths from ar_index_global_meta.txt file for given floats and optionally creates a .txt file
- get_floats_data_gdac_v3_FINAL: gets data from tech, traj, aux or meta file and formats it to have the same number of cycles for the same float get_traj_param
- calculate_CyclePeriod
- calculate_CTDPoints
- format_data_for_plotting
- get_matrix_barplot: Make a matrix for grouped bar plots
- suptitle
- M_MAP: Package permitting to plot map , with coastlines, certain isobaths, etc... Visit the following link to download the package and access the package documentation: M_map
- export_fig_package: PAckage to export a figure as png in a specific folder
- get_csv_QGIS: Create a csv file permitting to easily re-create the plot in QGIS
- get_verticalkm_age_multiprof: Compute the vertical distance traveled by a float (in kms) taking into consideration the number of profiles made and the max pressure reached for each profile.