Home
This is the rabbit hole I went down to answer the question, what is thailands positive rate and how much testing is actually happening. The end result is a daily automated scrape of all the various sources of Covid data combined and downloadable for you convenience. This resulted in even more quesitons, which I've collected here. m
The first data I found (and others) is the Daily Situation Reports, especially as they are translated into english. Parsing these you can get data going back to April 2020.
"Total number of laboratory tests" stands out as an interesting number however once you plot this its clear that this number is now just incremented by the same amount as the PUI number each day. PUI stands for Person Under Investigation and represents someone MOPH has determined is a high risk of having Covid. There is a formal criteria which is available and is a mix of symptoms and who you have had contact with. I think only walk-in cases can be PUI. It also becomes clear that most of the other numbers like proactive tests are no longer updated so also meaningless. The only numbers that are useful are
- Tested PUI: People Classified as Person Under Investigation.
- Tested PUI Walkin Public: "Sought medical services on their own at hospitals"/Public
- Tested PUI Walkin Private: "Sought medical services on their own at hospitals"/Private

I'm not sure why they use the wording "Total number of laboratory tests" but the number doesn't match actual testing data found elsewhere and wouldn't match total number of people tested either. I suspect they intended for it to be for people tested but couldn't update all the numbers so the calculation is done on a sum of numbers that aren't accurate.
Our World In Data (OWID) graphs Thailand testing data. In Jan it was a month out of date.
Our World in Data Testing Graphs
From OWID I found DMSC: Thailand Laboratory testing data - weekly summary reports
I parsed the XLSX with testing data from the MOPH shared folder. It contains a Pos number (presumably Positive test results) and a Total number (presumably total number of tests performed. In also also numbers for data that didn't have an assigned date up until the 3rd April. In the tests graph above I've included this data by distributing it relative to existing data before the 3rd of April.

I discovered there was additional testing information is a series of powerpoints (in both PPTX and PDF formats). This broke the tests down by health area and by private vs public. It also includes information of which hospitals performed the tests (not yet parsed). Due to missing files I ended up having to parse all these different formats.
The PUI's follow the testing numbers reasonably well (except for April and Jan which we will discuss later), but there are a lot more tests performed than PUI. Even during the period between the waves, PUI's numbers dropped but tests remained at about 8000 a day. In the graph above I've included the total tests (public+private) and just the private for comparison.
You'd think this number would be the easiest to get and understand but there seems to be some big differences between positive tests and confirmed cases.


From the situation reports you can also get a breakdown of cases that helps us understand what is going on

During the second wave positive results and cases were closer up until early February. At this time there was a government initiative to do large amounts of proactive testing in factories with migrant workers. This resulted in a big jump in confirmed cases however it didn't seem to result in a similar jump in positive test results. For some reason these tests seem to be excluded from the testing data. At the same time there isn't a large jump in numbers of tests either.
In the 3rd wave cases were again higher than positive tests. It appeared proactive and prison testing might not have been included. The initial large announcement of prison cases was on the 17th May. Curiously the 27th May was a large spike in positive test results, about ~7k greater than average for this time. There wasn't a spike in tests at the same time. If we look at cumulative figures since 1st April 2021 the positive tests is more than cases but only just.

We can also try to smooth out the data by using a 21 day moving average.

From the test data by area we can see which areas have more cases than public positive test results. A positive value means more cases than tests. NOTE the district testing data averaged over a week so comparing it on a day basis like this might not be accurate. In addition prison cases are separated out of the province data but the test data just has health districts and if prisons are included its not clear where which health districts.

There are few possibilities
-
Maybe Combinational pooled Testing was sometimes used
- e.g. Origami Assays can confirm/clear 600 patients with only 60 tests
- But would labs report single assay as a "positive test" or the result of how many were confirmed by the combinational approach?
- This would also drop the total number of tests performed also at times where this used used
- News report from May 2020 says they use it for proactive tests
- Thailand doesn't appear on the list of List of countries implementing pool testing strategy against COVID-19
-
Maybe double entry failures
- the system for reporting cases (co-ward) and reporting tests (co-lab) are two seperate system (TODO: reference)
- Delays or omissions might happen if there isn't a need to always enter both at the same time, for example payment for some kinds of tests might rely on entries in co-lab but others might not?
-
Maybe some Anit-body tests were used without PCR test confirmation afterwards
- Reports seem to indicate some cases are "historical" which could mean antibody tests were used which would be unusual.
- The MOPH testing data seems to only be for PCR tests
-
Bangkok Post article on 26th Dec 2020 where the governor of Samut Sakhon refers to using blood tests.
Samut Sakhon governor Veerasak Vijitsaengsri said on Friday that he has ordered the testing method to be changed to ensure quick results and cover all at-risk groups of Thais and migrants in the province. The current method of inserting a swab into the nose to get a fluid sample will be replaced by taking blood samples from people, the governor said, adding that results from the new method come back in 30 minutes and costs are cheaper.
-
WHO report 26 Jan 2020
Rapid tests that require a blood sample and that can provide results within 30 minutes will be used in high risk groups (both Thai and migrants) in Samut Sakhon to supplement the nasopharyngeal swab
-
WHO report on 31 Jan 2020 seems to indicate antibody tests were used to confirm cases in migrant workers
The high daily case count of around 700 new cases per day for the last 6 days reflects the surveillance strategy of targeted active surveillance amongst the workers in the 4,000 plus factories located in Samut Sakhon. These large counts reflect the testing methods (see Sitrep 123 for an explanation) and represent both current and historical infections, and therefore the large daily case counts are not necessarily all new infections.
-
Maybe some proactive tests are excluded from Test reports deliberately
- Since positive rate is reported in these reports and proactive testing results in a misleading higher positive rate than a more random walk-in approach perhaps the decision was made to exclude some test results? OWID for example try to exclude proactive testing from positive rate calculation.
OWID: "we don't think it is necessary to include tests or cases from proactive test finding in our calculation of the Positive Rate. This is because we use the Positive Rate as an estimator for testing capacity within a country, not the fraction of the population that is infected. Including tests from proactive case finding breaks the condition of random sampling, as they would obviously have a much higher probability of being positive, and so would lead to a biased estimator."
- Both tests and positives don't seem to rise during times of proactive testing.
- Since positive rate is reported in these reports and proactive testing results in a misleading higher positive rate than a more random walk-in approach perhaps the decision was made to exclude some test results? OWID for example try to exclude proactive testing from positive rate calculation.
-
Maybe Antigen tests were used without PCR test confirmation
- No evidence rapid tests were used to confirm cases other than they are available and used by provinces for allowing travel in some circumstances.
-
Maybe Simple Group Testing was used
- This seems unlikely since a positive group result means further followup testing of each patient in the group.
It's hard to draw a conclusion but it seems more probably that antibody tests were used in Samut Sakhon proactive tests or there was a deliberate decision to exclude some proactive data. Any of the other reasons could also turn out to be true however.
It does mean however that the actual number of tests is higher than this data shows.

In the first wave (April) there seemed to be a lot more positive test results than confirmed cases. Even the number of private positive results was greater than confirmed cases. A single case could be tested multiple times so you would expect positive results to be larger than confirmed cases, however in April it was up 5 times higher which you wouldn't expect. There are few possible reasons for this.

One way to work out if enough testing is being done is to measure positive rate, or the share of positive results of tests being performed. Since we also have an idea of the share of positive people compared to the people who were tested (at least for free/public) we can also compare this rate. This should answer the question "if we test more will we find more", because if we are currently testing and only finding 1 in 100 positive then testing more might not that much more.
WHO recommends a positivity rate of under 3% saying this is a sign the country is doing enough testing.
Since we aren't sure on the confirmed cases in April or the positive test data in Feb it makes it hard to know which positivity metric is more correct. However
- The April rate is similar if you use confirmed cases/PUI or positive results/tests (what you are supposed to use?). It shows not enough testing was being done. This is not surprising given the test capacity was in the process of being ramped up like in most other countries.
- The mid year positive rate is good. Testing was happening despite no cases. Even if you take out the private test data (which might include more ASQ tests?).
- Mid dec we see a worse positive rate as the SS cluster emerged. But a lot worse if looking at confirmed cases/PUI - so possibly antibody tests were being used here too? Feb saw an even larger difference due to the use of antibody tests. What this means is you can't really rely on the positive rate from dec to show whats going on.
- Positive rate doesn't tell the whole story. It assumes people are equally likely to be tested or that the most at risk are likely to be tested. Is testing equally spread out across the country? Migrant workers had perhaps had disincentives to not get tested (lack of insurance, illegal immigration status, not much money or time to go to the doctor, fear of losing income by being quarantined etc). There could be other groups who also have a disincentive.

Positive rate is calculated as pos/tests for each area and then scaled according to the total positive rate for that time period.


TLDR; Maybe but it's hard to tell. 3rd Wave tests do seem to max out at 75k/day but that could also be due to demand. We also know some proactive tests seem to be missing from these numbers.

If there are many possible limits
- Lab testing throughput
- MOPH gives a list of labs used for PCR covid tests but not the capacity of each.
- Swabs or other resources needed for testing
- Hospital/testing location throughput
- Bed capacity - due to compulsory hospitalisation some hospitals might limit testing because they can't take more patients. There is some anecdotal evidence for this
- some daily budget for tests?
If there was a testing capacity problem, and there is some prioritisation/bias of testing more symptomatic cases, then you would expect to see:
- Positive rate increase
- Assumes those more at risk are more likely to be prioritised

- Different positive rate between private and public hospitals
- Assumes private hospitals will test lower risk people so private positive rate would be lower
- Positive rate between private and public labs is almost the same in the 3rd wave. However it's unclear if public hospitals can use private labs
- Death trends to not match case trends
- This plot isn't deaths but deaths adjusted by IFR per province and backshifted, but the curve is similar to deaths. The assumption is that deaths are more accurate than cases at showing the true trends with infections

- There are a lot of assumptions with this however. One is that suspected covid deaths are counted/tested even if they died outside of hospital or without being tested before death. If the only covid deaths are those that got tested ahead of time and those people who die aren't any more likely to get tested than anyone else then then the curves would be the same.
- change in ratio of symptomatic/asymptomatic cases
- If testing is prioritised based on symptoms (either deliberately or because symptomatic people are more motivated to get tested) then you'd expect to see the proportion of asymptomatic cases to go up.
- Unfortunately this data is no longer available in reports I've found so far.

Note: it's possible that queuing could make it random who gets tested or even disincentivize sick and elderly. In this case it would be hard to tell as positive rate and other data would look the same, esp. if suspected deaths from covid are not routinely tested.
- There are 314 labs (and rising).
- but we don't know estimated capacity
Private hospitals do put limits on free tests e.g. BangkokHospital limits free tests to 50/day and by appointment only which implies it's based on first in first served, not based on risk.
- TODO: plot testing rates of top public hospitals to see if they reach a limits.
You would expect to see more symptomatic being less reluctant to get tested so you would expect to see positive rate go up.
TLDR; yes but maybe not as many as people think.
Every country with covid cases has infections greater than confirmed cases, but the amount varies and can only be estimated.
A low positive rate is a good indication that infections is not that much greater than cases. It does assume that the way in which people gets tested random. ie two people with an equal chance of being sick will each have the same opportunity and inclination to get tested. If high risk people are skipped you can have undetected clusters.
A very simple model can be used to get a lower estimate by taking global research on the viruses infection fatality rates for different ages and applying it to difference province demographics in thailand and then applying it to the known covid deaths shows estimated infections with a similar pattern to the confirmed cases.

However the following would all push up the infections estimate
- many untested covid deaths
- the elderly in thailand being less exposed than the global average.
- lower prevalence of diseases that increase the risk of dying
- better health care and quicker detection than global average
- less deadly virus variants being dominant
- Bangkok's real mean age being younger than the 2019 census data
More detail models with predictions that take into account factors like Goggle mobility data to predict infections based on adherence to social distancing measures.
- ICL Covid Model Thailand (OWID ICL),
- IHME Covid Model: Thailand (OWID IHME)
- LSHTM Model: Thailand.
- OWID Covid Models for Thailand lets you compare these infection estimates.
- These models tend to fluctuate a lot in their infection estimates for thailand and have high upper and lower bounds (error) so it's not clear how seriously they should be taken.
- It's unclear how much, if at all the specifics of the way thailand does its testing and reports its numbers is taken into account. For example Prisons infections are not a good measure of wide spread community spread. It's not clear which extra factors result in the much higher estimates than the simpler IFR model above.
Testing wastewater is another way to estimate infections and showed that infections were present in and around Bangkok from Oct 2020 before cases were discovered in Dec 2020.
- TODO: use case ages to refine model (assumes case ages more closely represents infected ages than population).
- TODO: use extrapolated IFR model rather than steps. so far this almost doubles the IFR 0.9-1.1% but not sure its correct yet. Depends a lot on how much the rate increases over 85. Some estimates its doubling every 8 years. This would bring the estimated infections close to confirmed cases (but with a higher median age).
In particular this questions gets asked a lot during April/May 2021
TLDR; No. This happens in many countries when the interventions are not enough to bring the cases down but are enough to stop increasing.
r0 is many much each person spreads the virus too if no one changes their behaviour. Interventions reduce that so the r-number becomes r(eff) r effective. That can be 1 or (close to it) and means on average 1 person will on average infect 1 other person leading to stable case numbers. Of course this virus is very clustered so 1 person might give it to 20 and 19 more give it to no one and we would still see flat daily cases when averaged out.
Also, as of June 2021, Walk-ins are going down, Proactive testing is going up and overall cases are going up. Nothing is staying very flat. What can seem like the same numbers at the small scale can hide a large trend viewed over time.
Estimates of IFR applied to Thailands population result in a predicted median age of around 80. The median age during the 3rd wave seems to 65-70. Why?
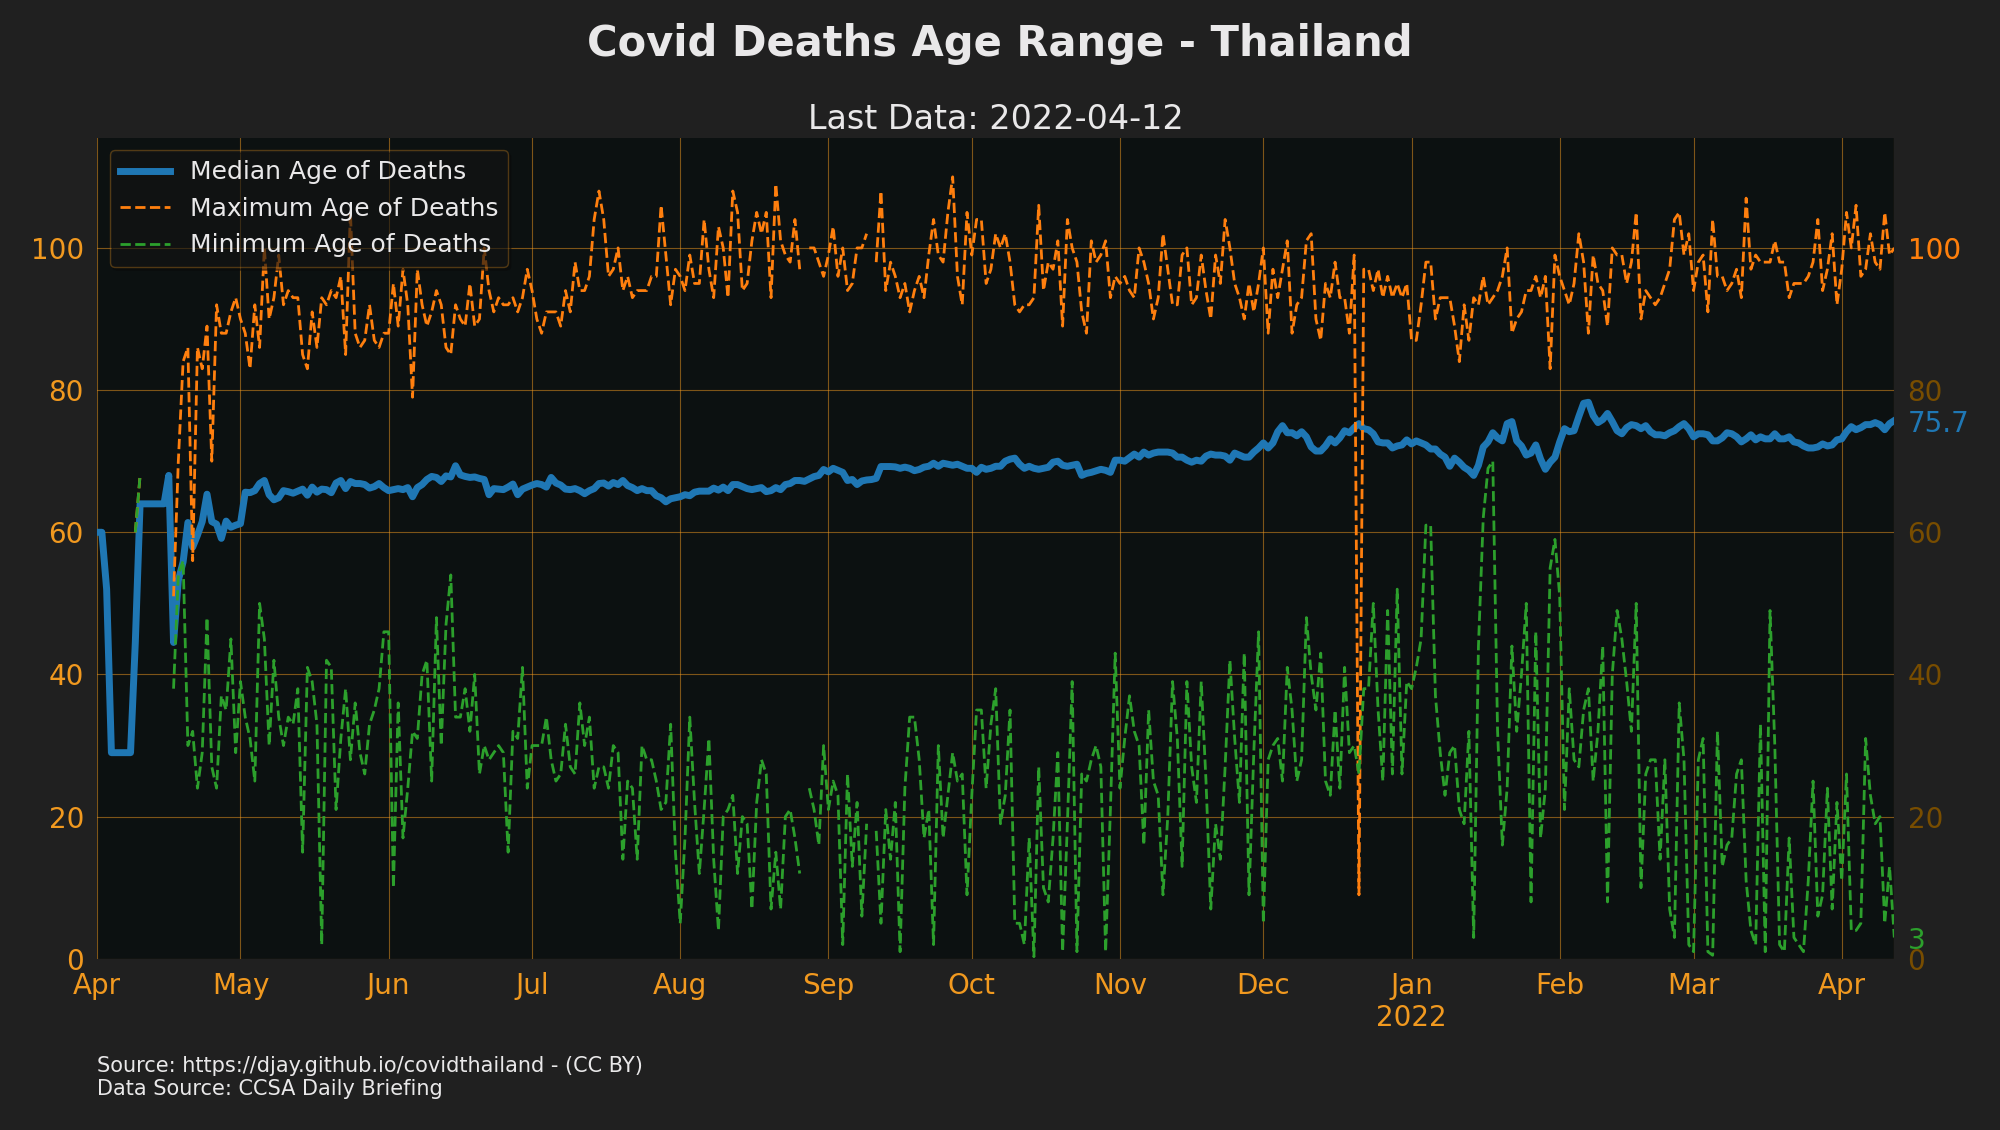
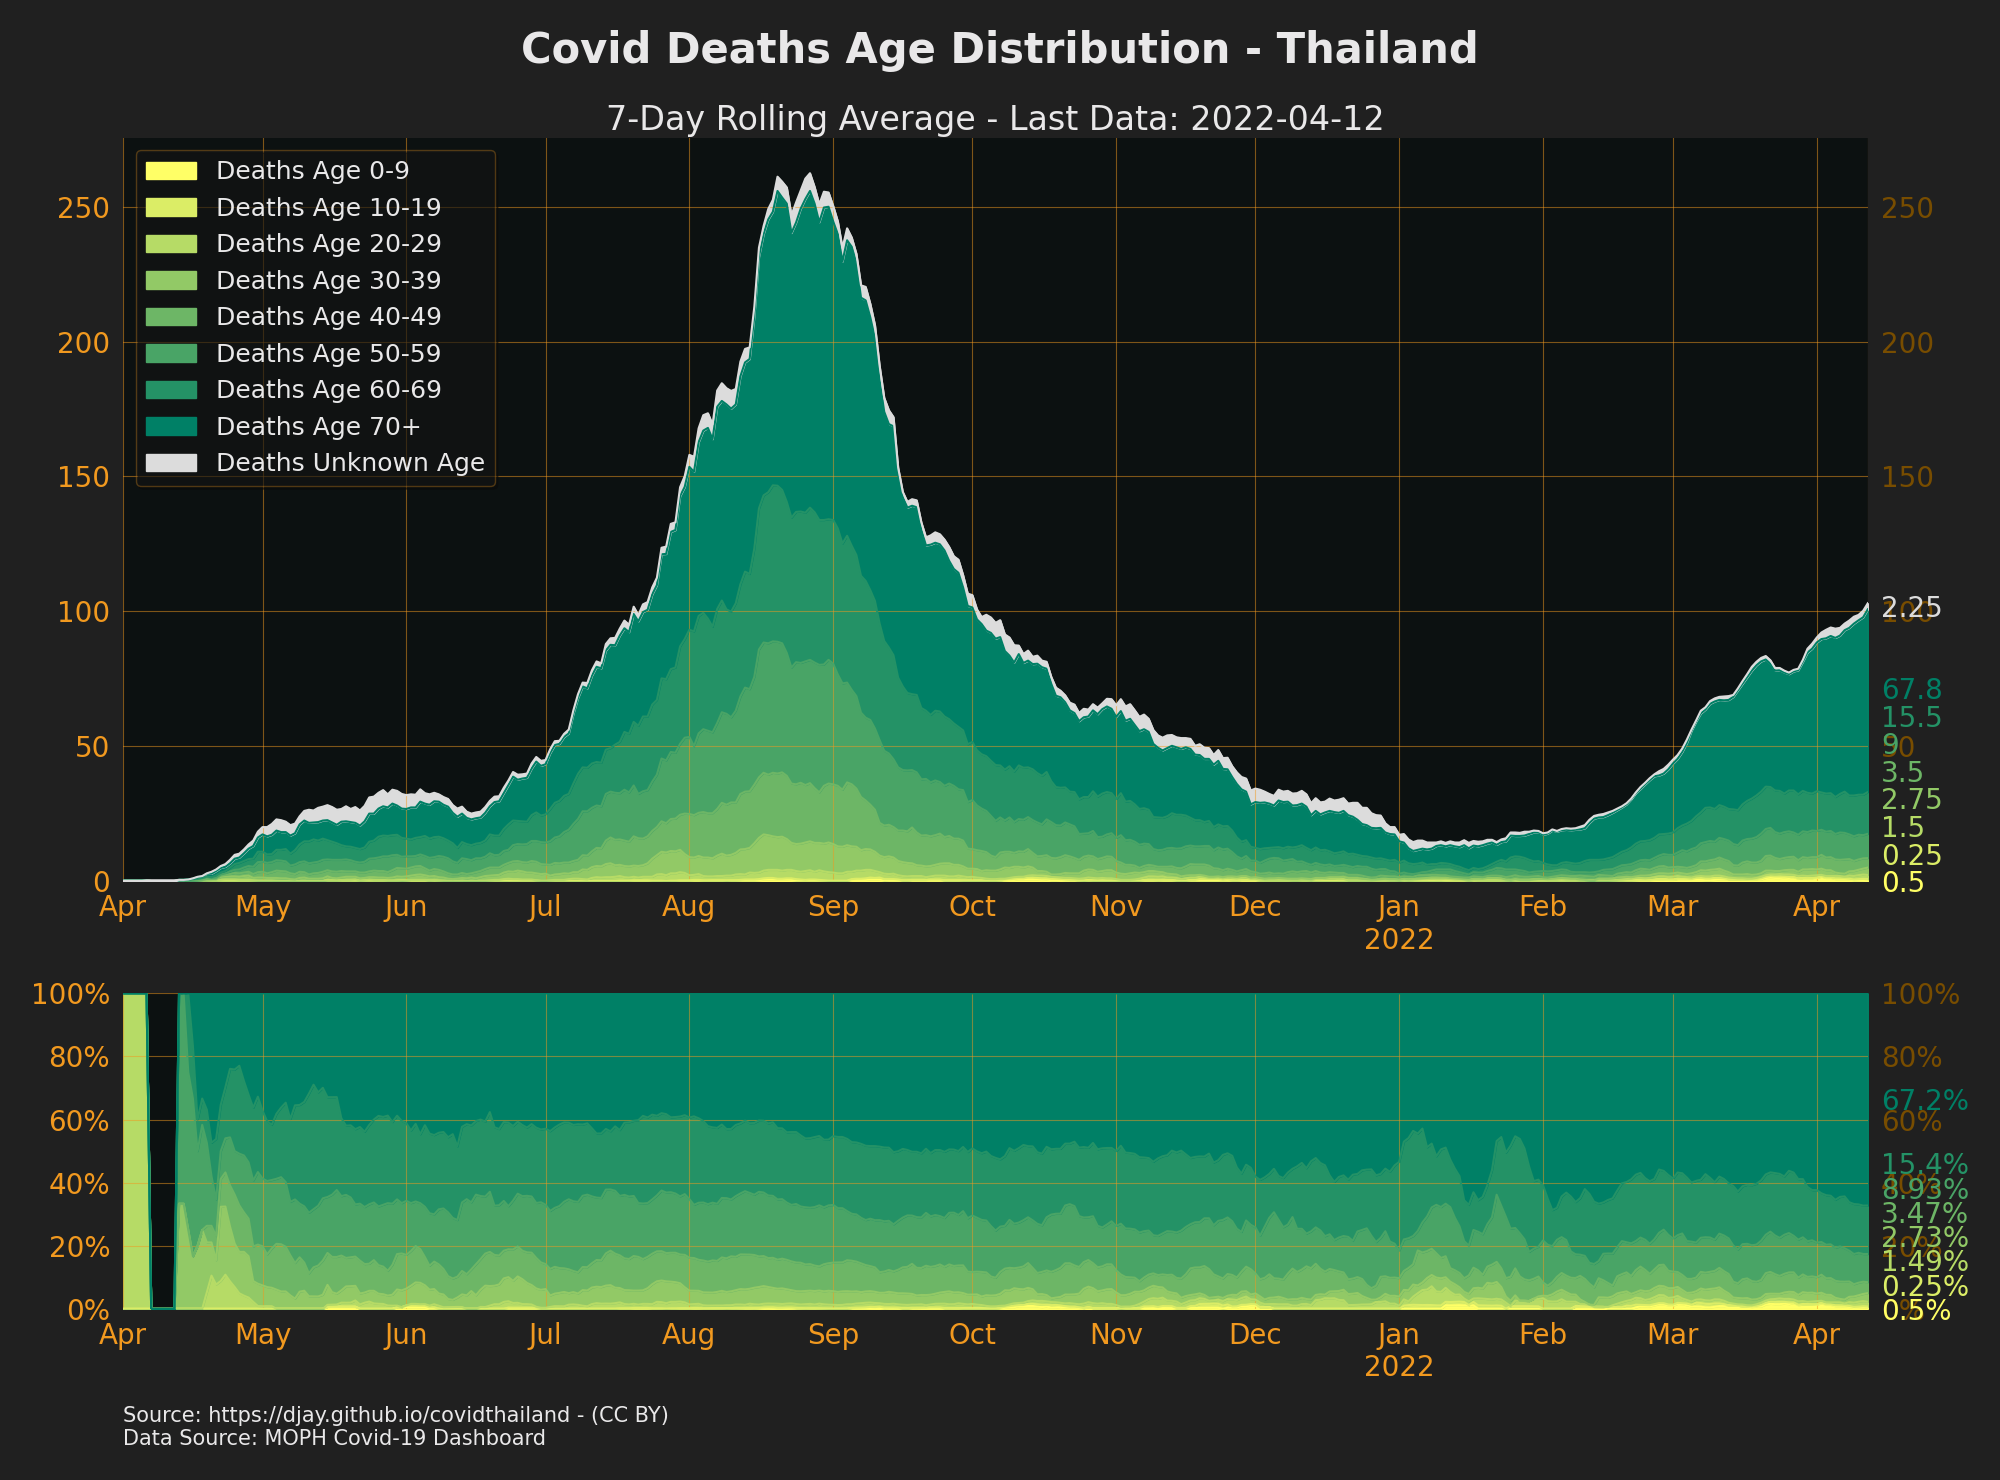
For comparison 2nd wave in UK about 90% of deaths were over 60
It's not really clear why this is
- Is the IFR in thailand lower than elsewhere why were elderly protected in thailand?
- previous exposure to similar infections like SARS?
- previous vaccinations like BCG?
- Lack of old peoples homes reduced spread in older age groups?
- is compliance in elderly higher than younger people?
- did the compulsory hospitalisation policy save lives by getting
- If the IFR in thailand is expected or higher then why are so many younger people dying?
- Are there more co-morbidities than other countries?
- did the testing capacity problem mean only younger people got tested as they could queue?
- Are there just lots of elderly excess deaths?
There is some interesting info in situation-no515-010664.pdf showing CFR for different ages groups across different periods. The ratio for elderly was lower in wave 2 than wave 1 or 3 which perhaps reflects the worker related cases found. The time to treatment was also shorter. Given the small sample sizes and potential issues with testing it probably just shows that the latest wave as more useful data.
TLDR; yes but maybe not by much
- Excess mortality is between -9% to + 11% but this is the result of many factors combined e.g. increase in suicides, decrease in road fatalities during lockdowns etc.
- One model estimates real covid deaths at only 1.25x recorded deaths
During the second wave there was a worry from some that testing was only happening in SS and known clusters. I discovered a source for that data so I've aggregated this over time.
This data is taken from the weekly summary of testing across the various Thailand health districts. The data is aggregated in date ranges so for this graph I've averaged the value across those dates. There is also one period of missing data in Nov. The data seems to match against the public testing data totals so it seems likely private tests are not included. For the labelling of the Thailand health districts I am unsure on District 13 found in the data as I couldn't find a definition for it. I've assumed its Bangkok but this could be wrong.

This graph comes from the public MOPH testing data. It's not clear if this is where the people who tested positive live or just where the labs where the testing took place. It's possible some tests were sent to labs in different areas to be processed. The high number of positives in Bangkok during jan/feb suggest that some tests might have related to cases in other provinces?

As previously noted this seems to be missing positive results and tests from Feb due to the not included antibody data so this time period is inaccurate.