Python code to re-produce results and illustrations of trajectory classification detailed in publications [1] and [2] :
Two datasets are used in the publication :
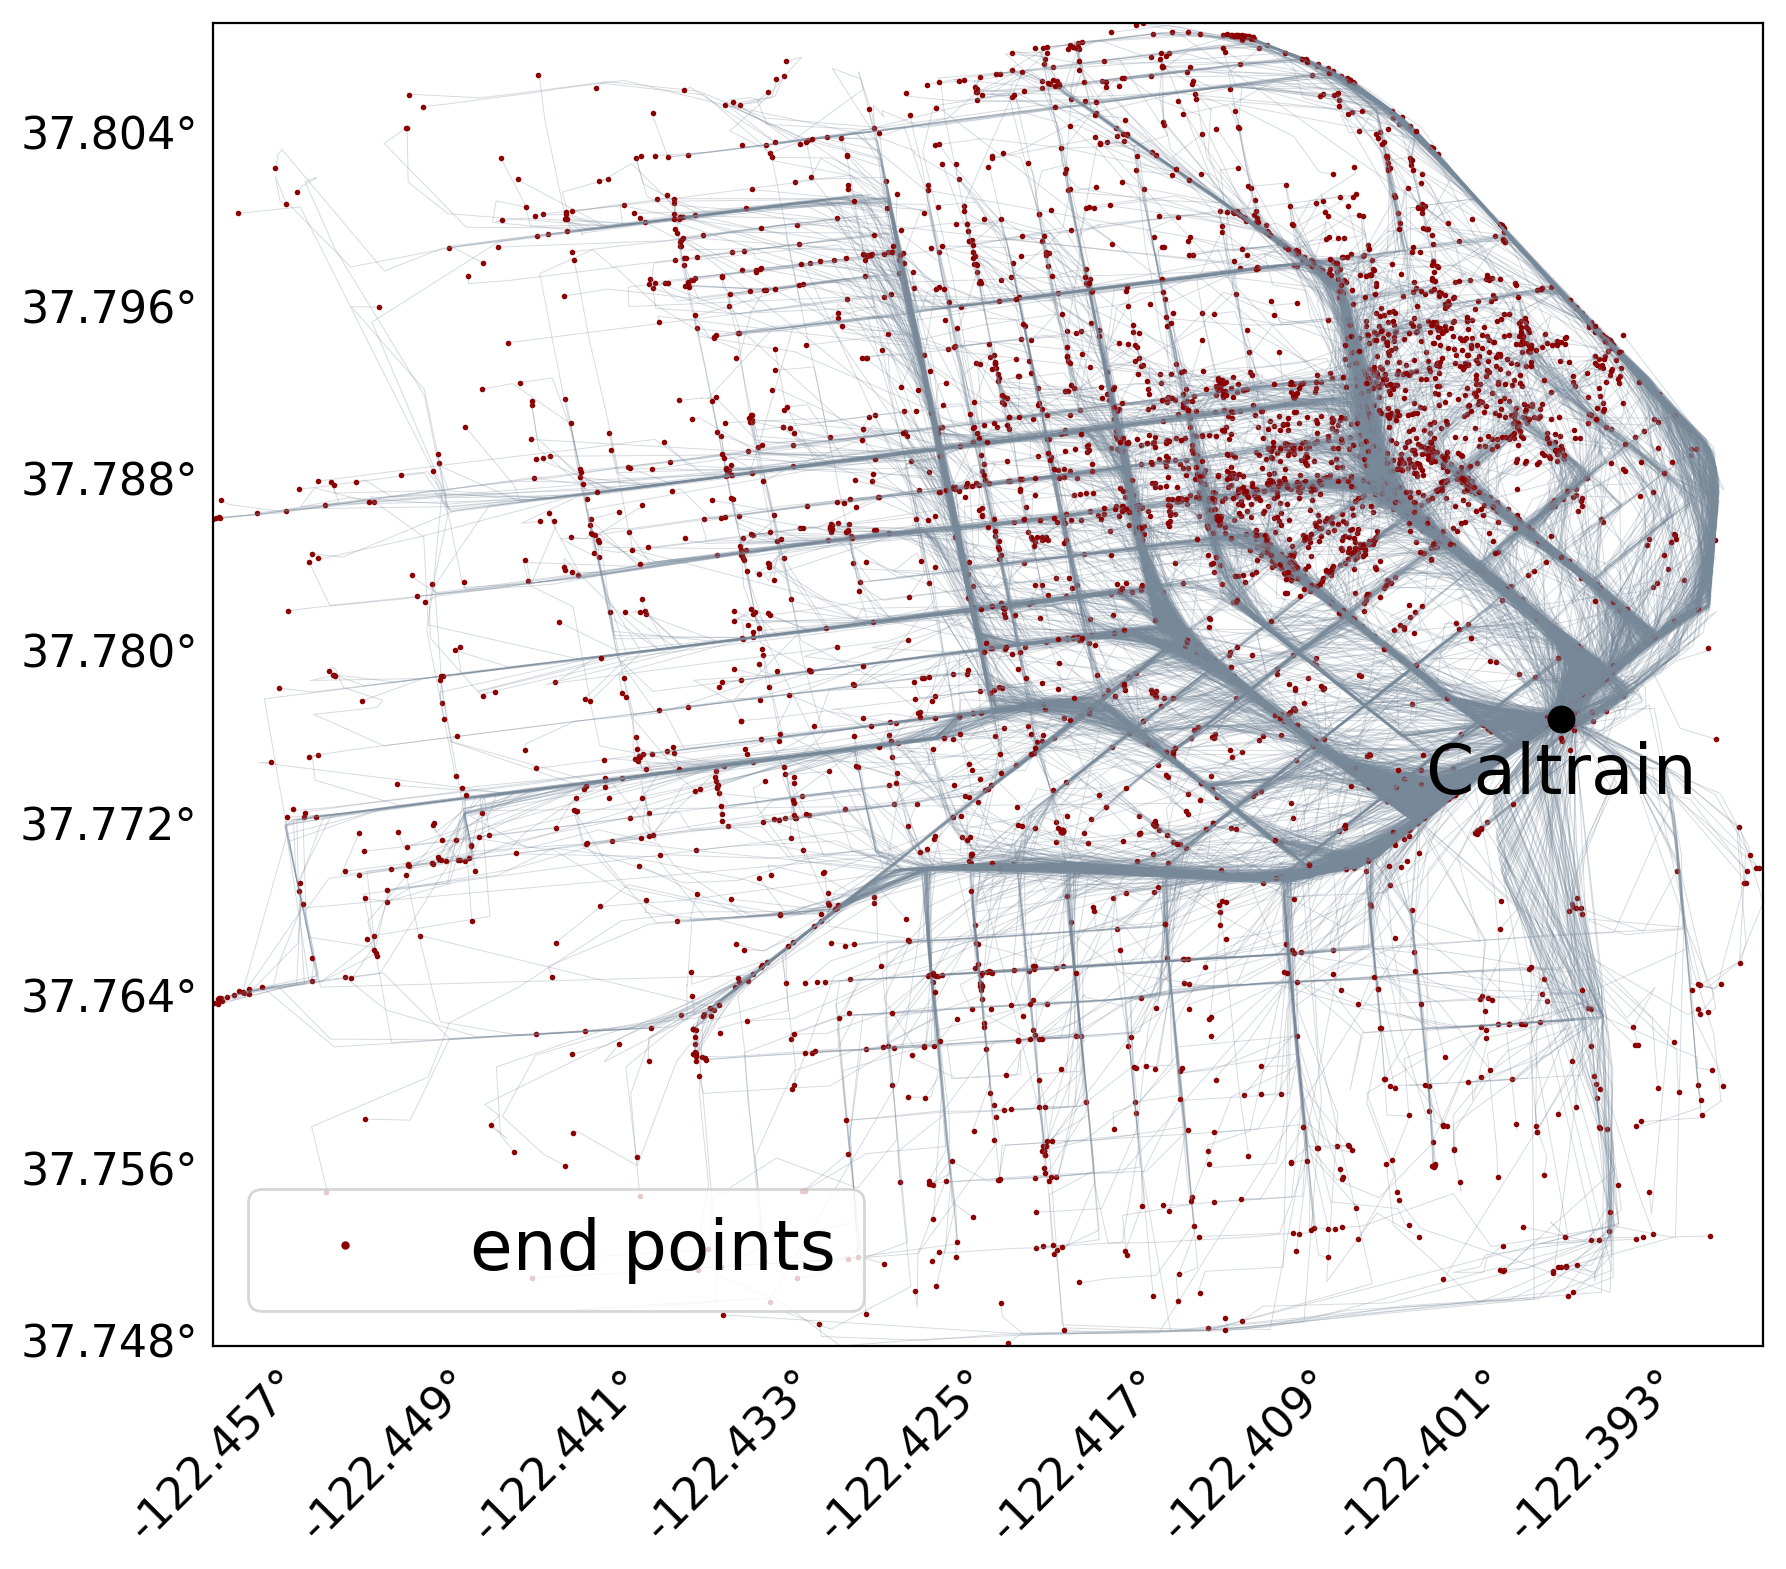
- Caltrain dataset is composed of 4127 trajectories from taxis which begin their trip at Caltrain station, San Francisco.
It is a subset of the cabspotting data set [3].
To generate this subset, download cabspotting file [3], move it into data folder and run
generate_caltrain_data.pyscript.
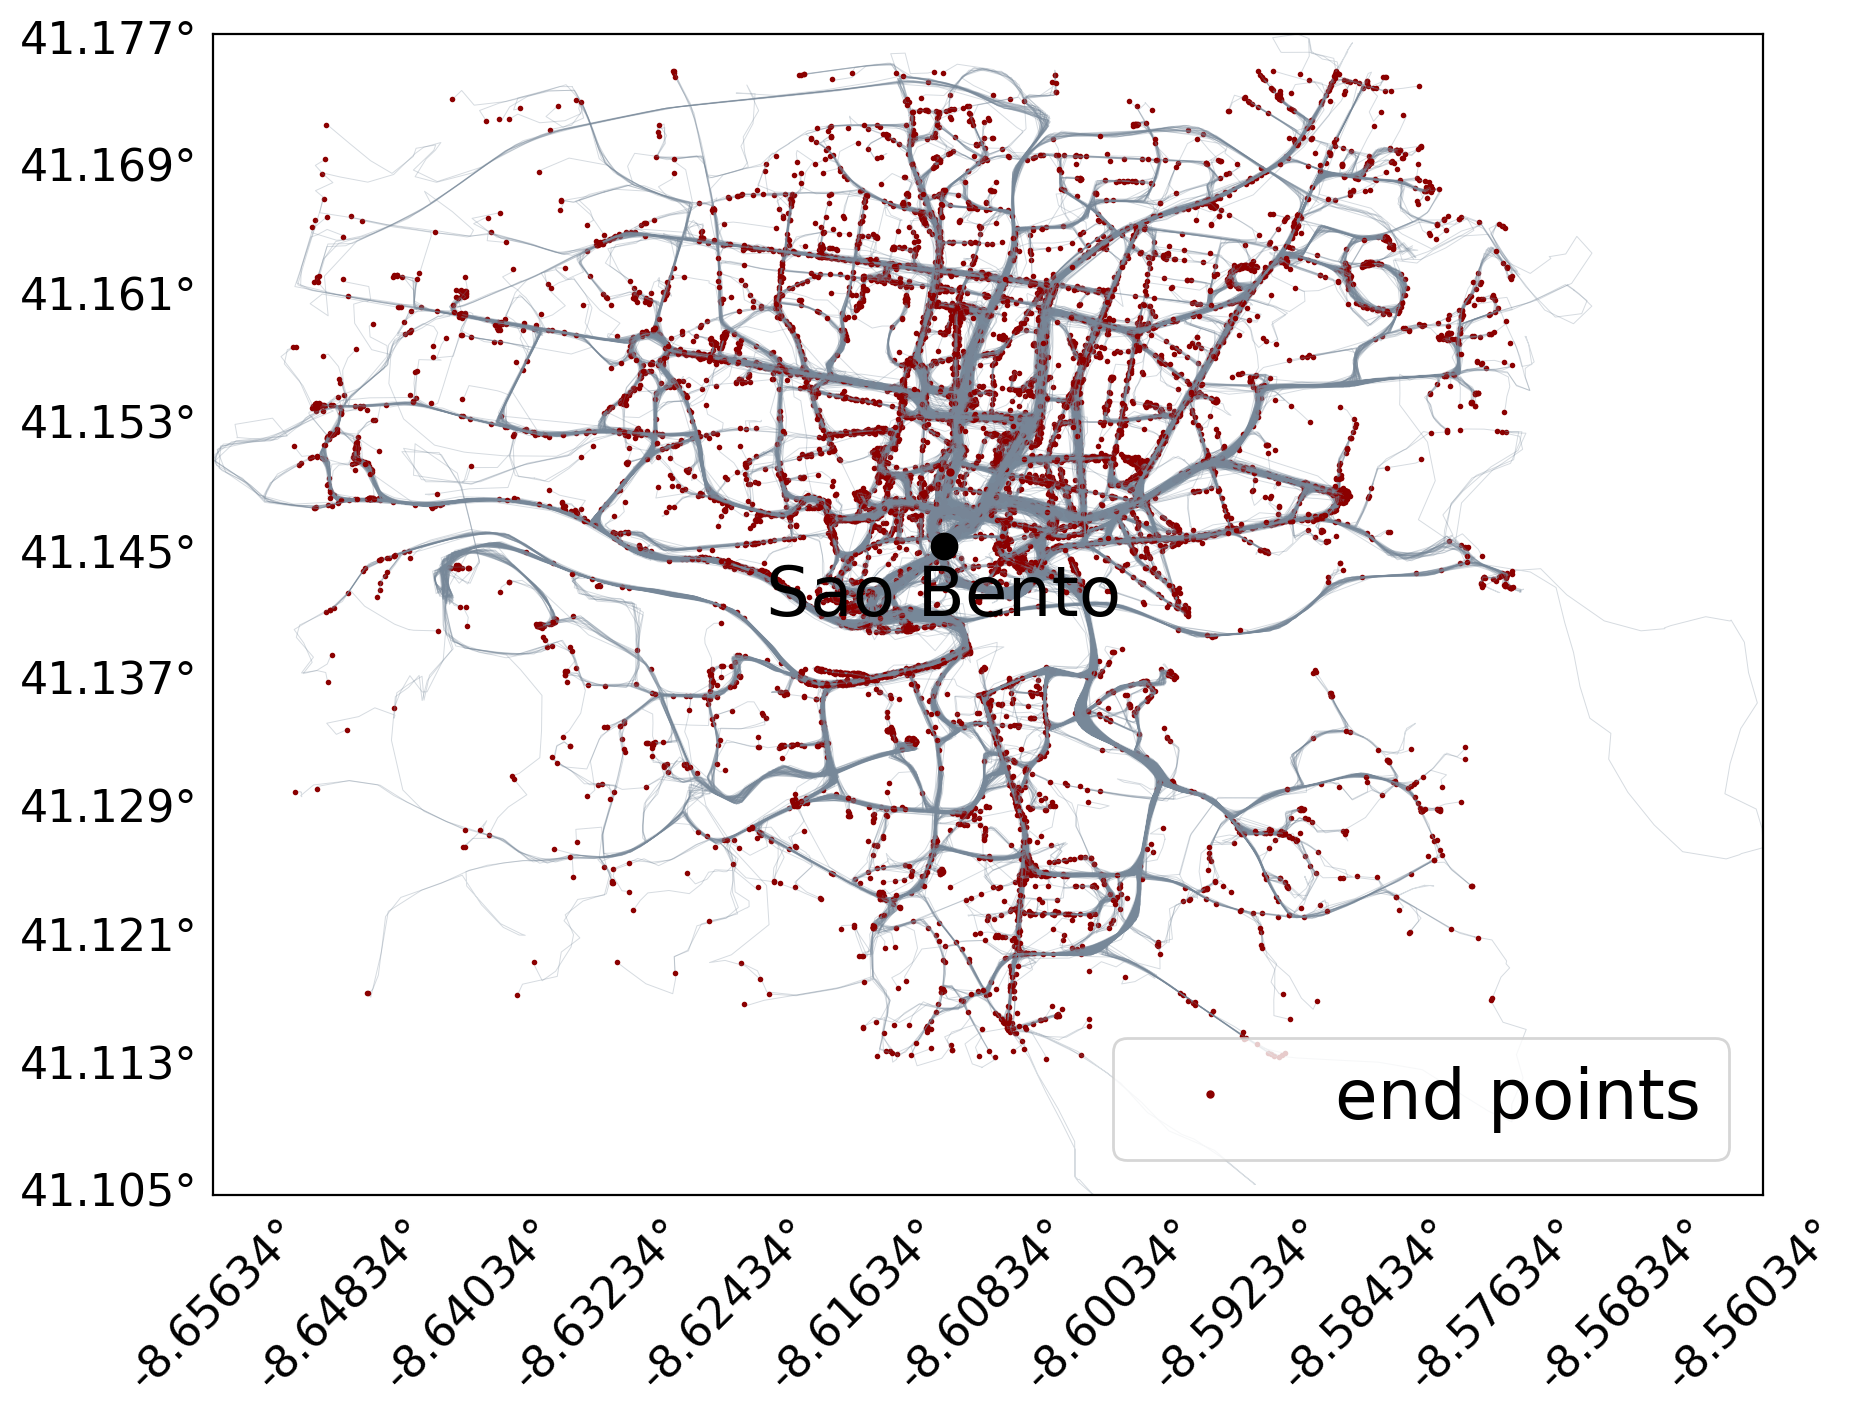
- Sao Bento dataset is composed of 19423 trajectories from taxis which begin their trip at Sao Bento station, Porto.
It is a subset of train dataset of the Kaggle ECML/PKDD 15: Taxi Trajectory Prediction (I) competition [3].
To generate this subset, download train.csv file [4], move it into data folder and run
generate_saobento_data.pyscript.
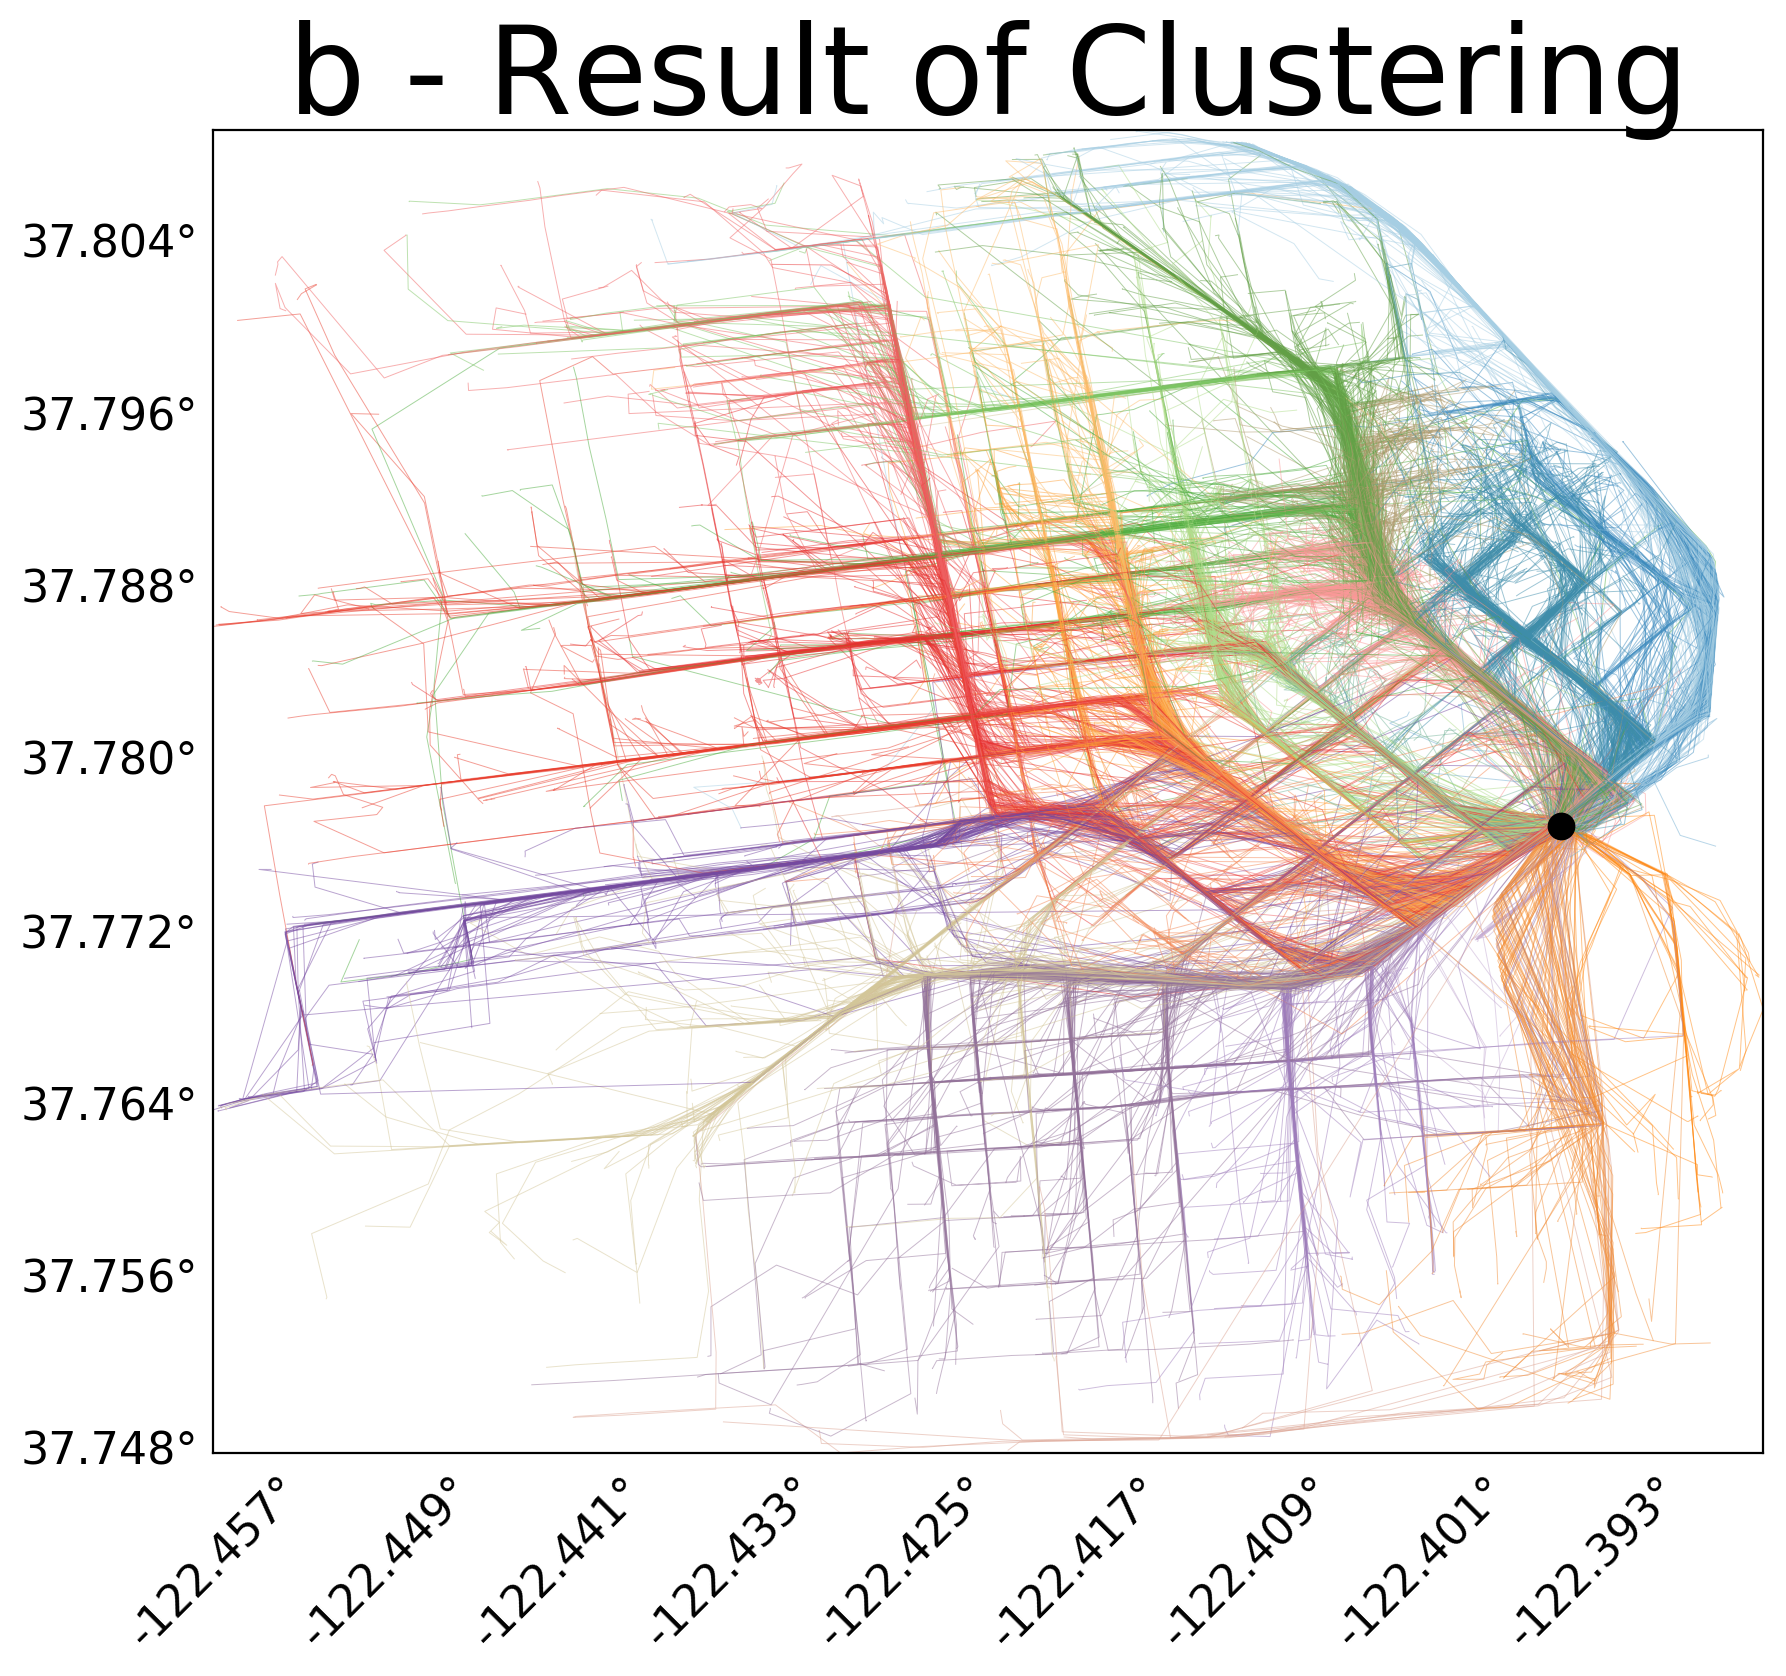
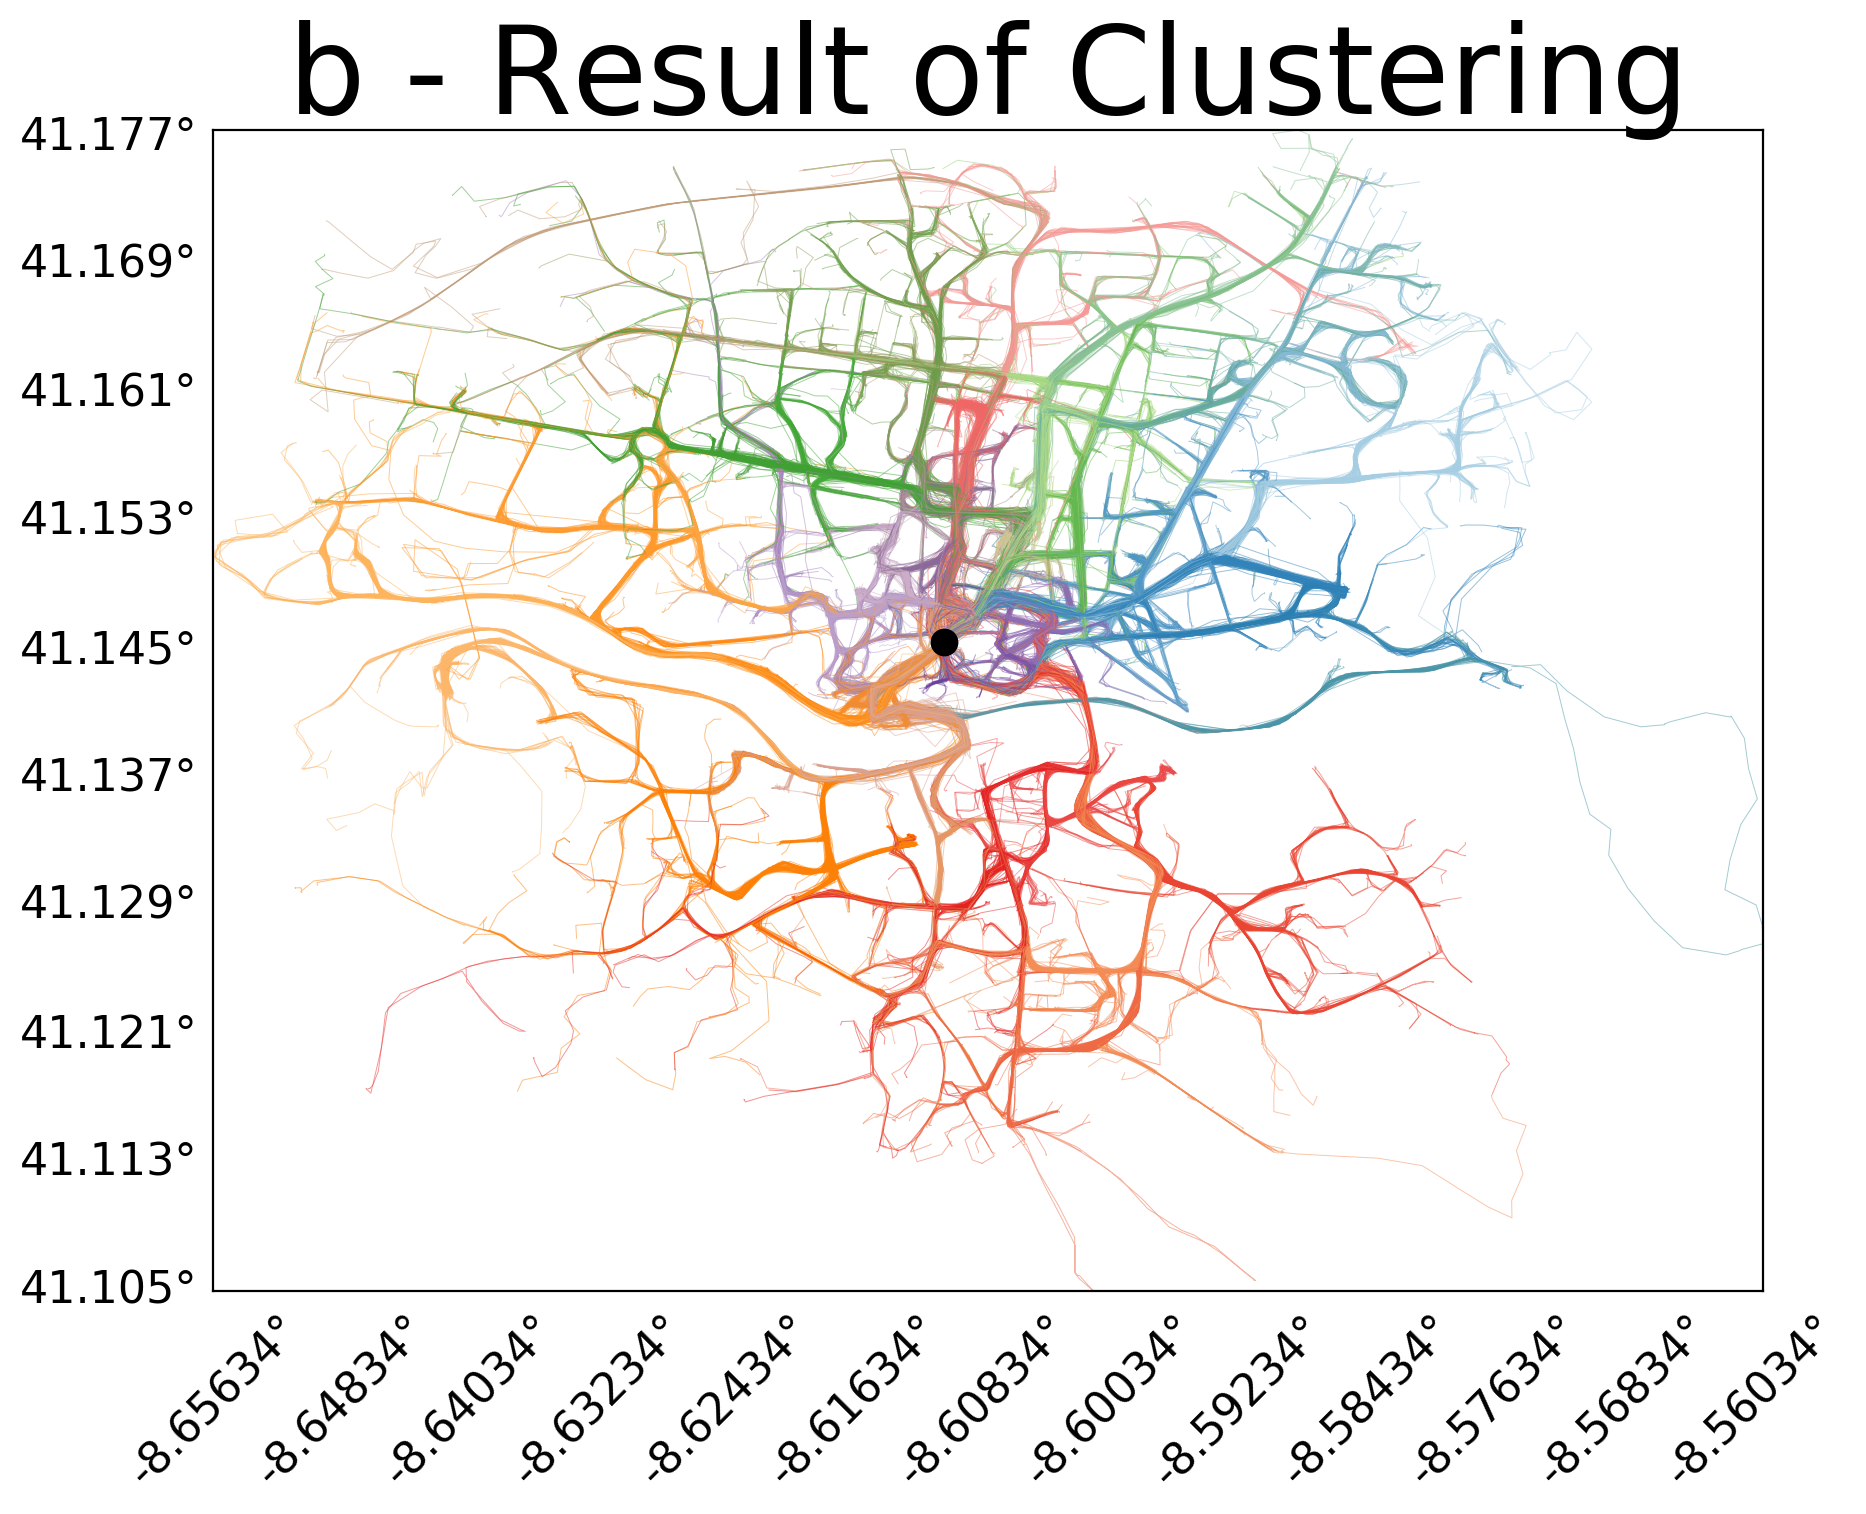
compute_distance_matrix.py: SSPD distance [1] are computed between trajectories of each dataset, using trajectory_distance package [5].trajectory_clustering.py: Hierarchical clustering is then perfomed on the distance matrices.figure_clustering.py: Produce the following png file.
generate_mm_cv.py: A 10-fold cross validation procedure to evaluate performance of the model describes in [2].trajectory_classification.py: Run the classification model describes in [2] and produces the following results :
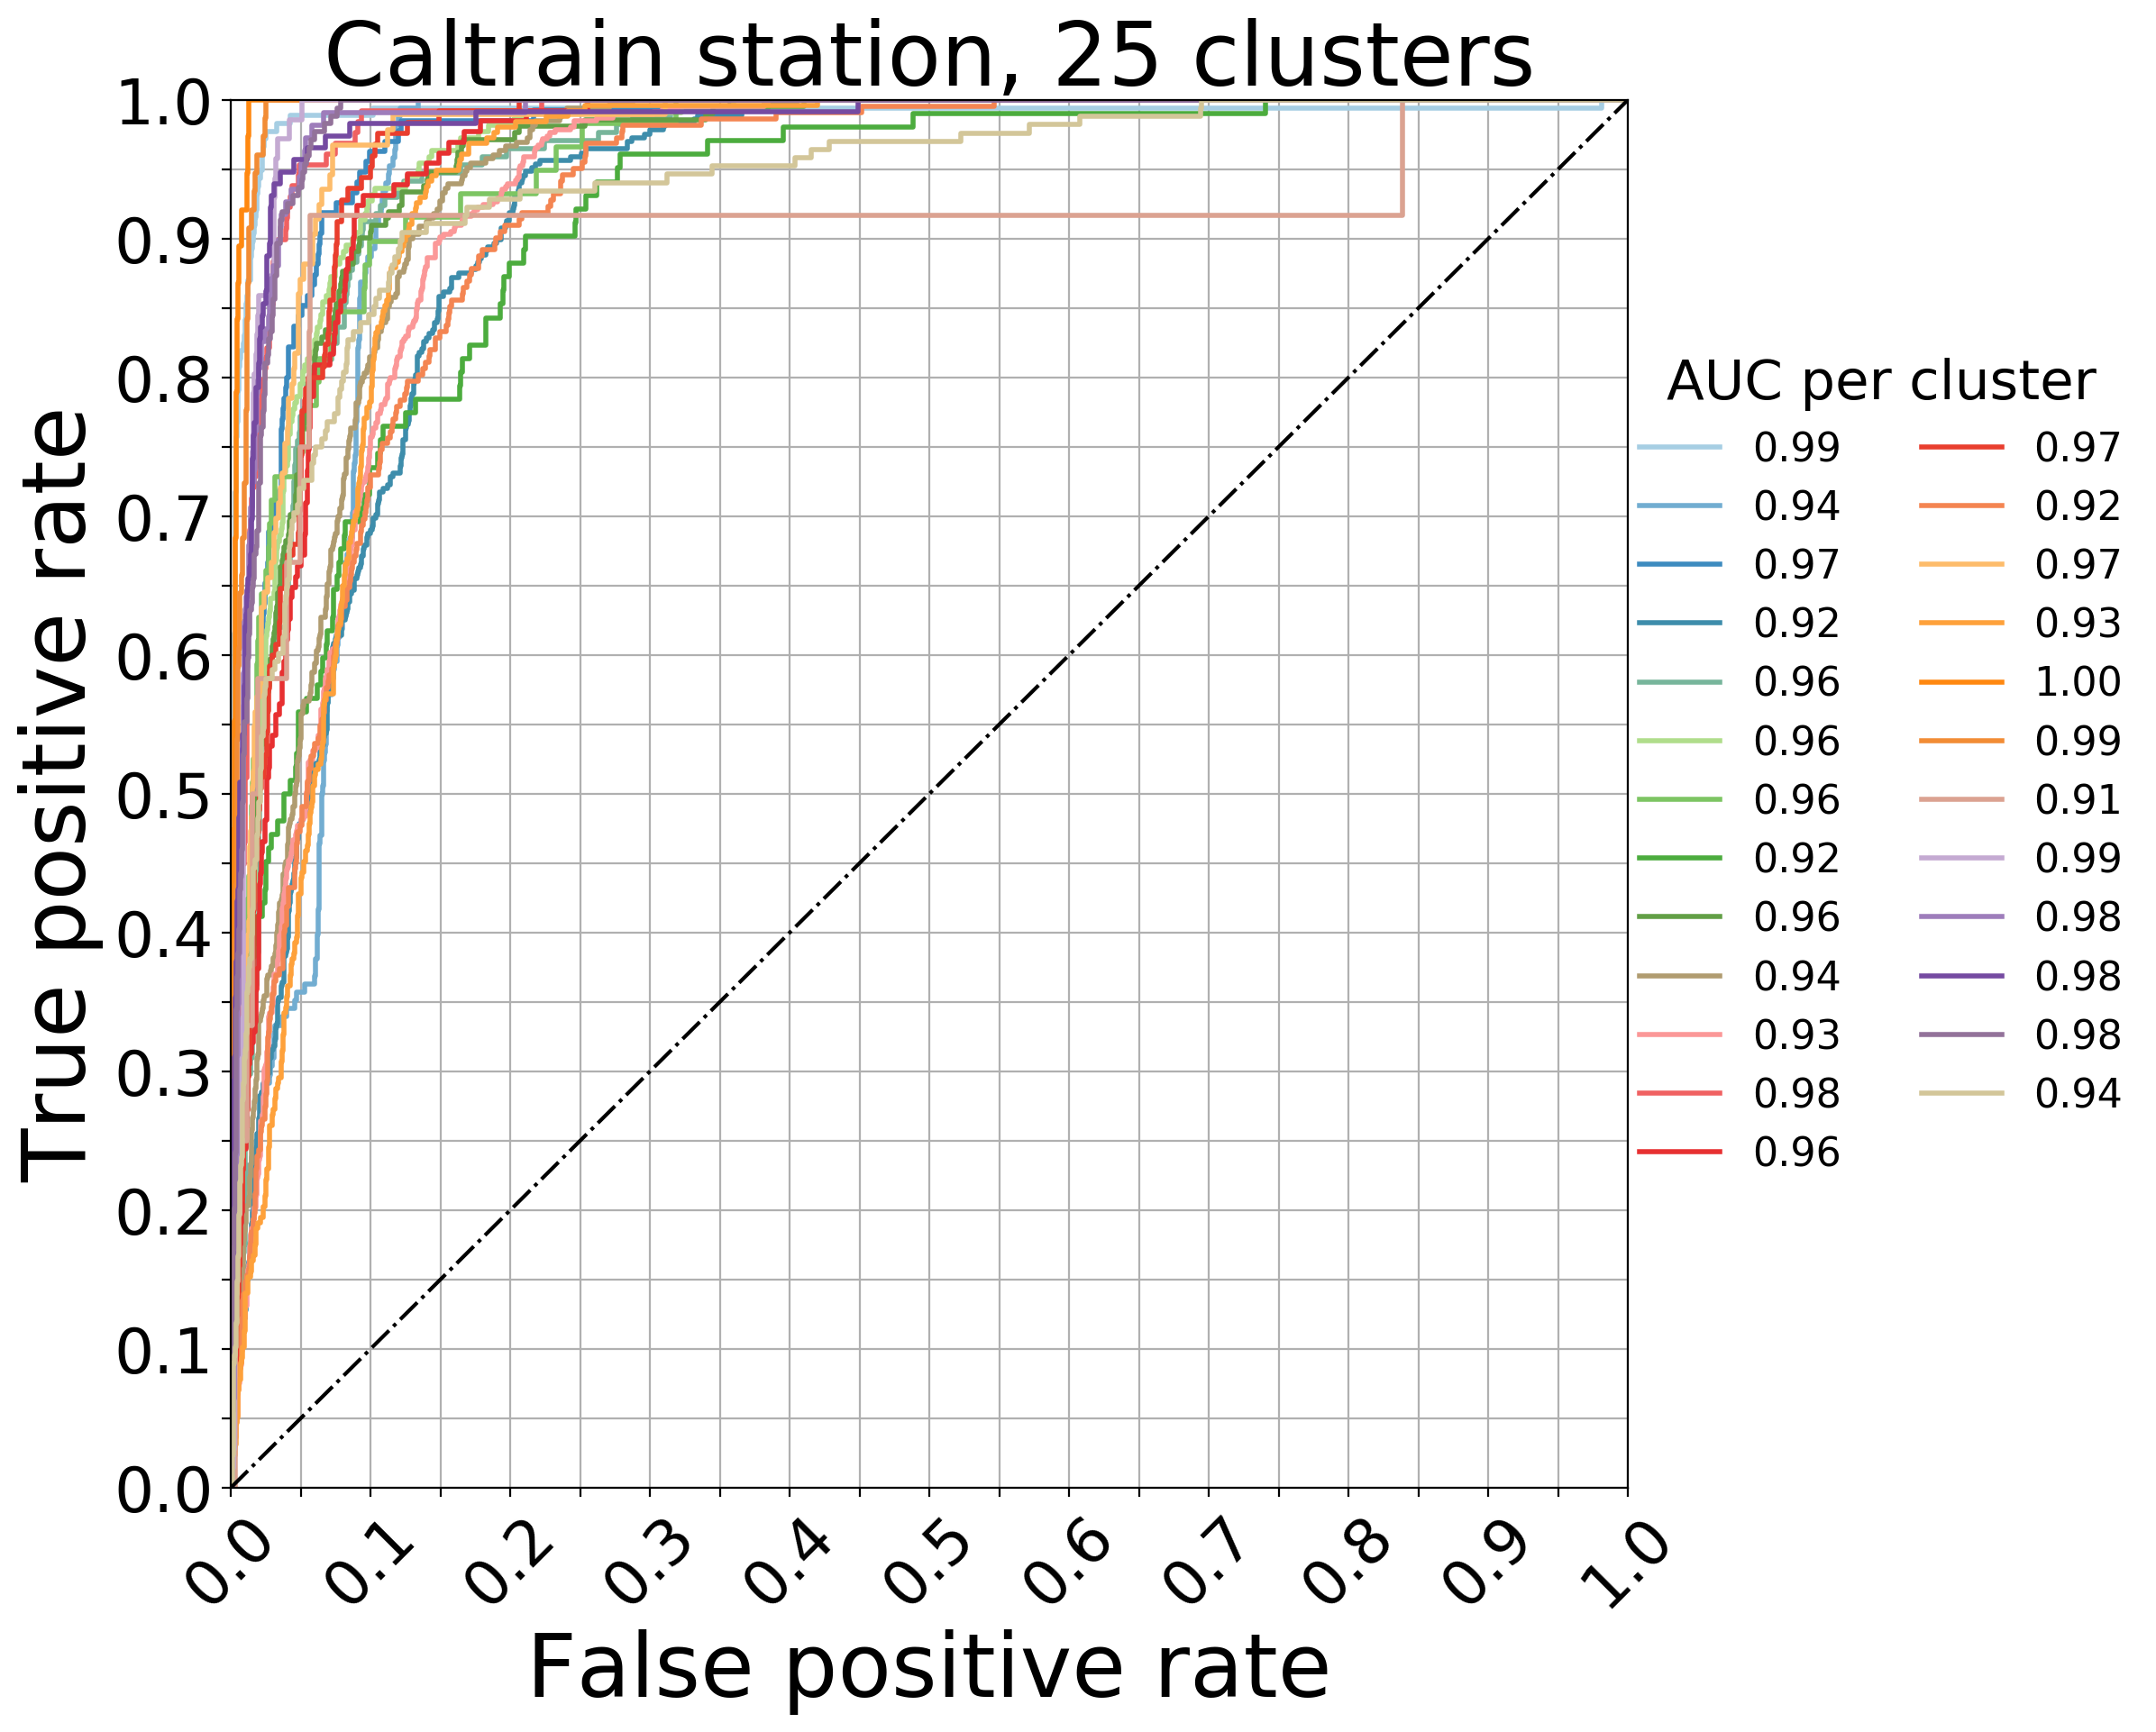
Caltrain Dataset
Percentage of well classified trajectory for Caltrain dataset : 90.89
Percentage of of trajectories where good prediction are within best-3 predictions: 98.45
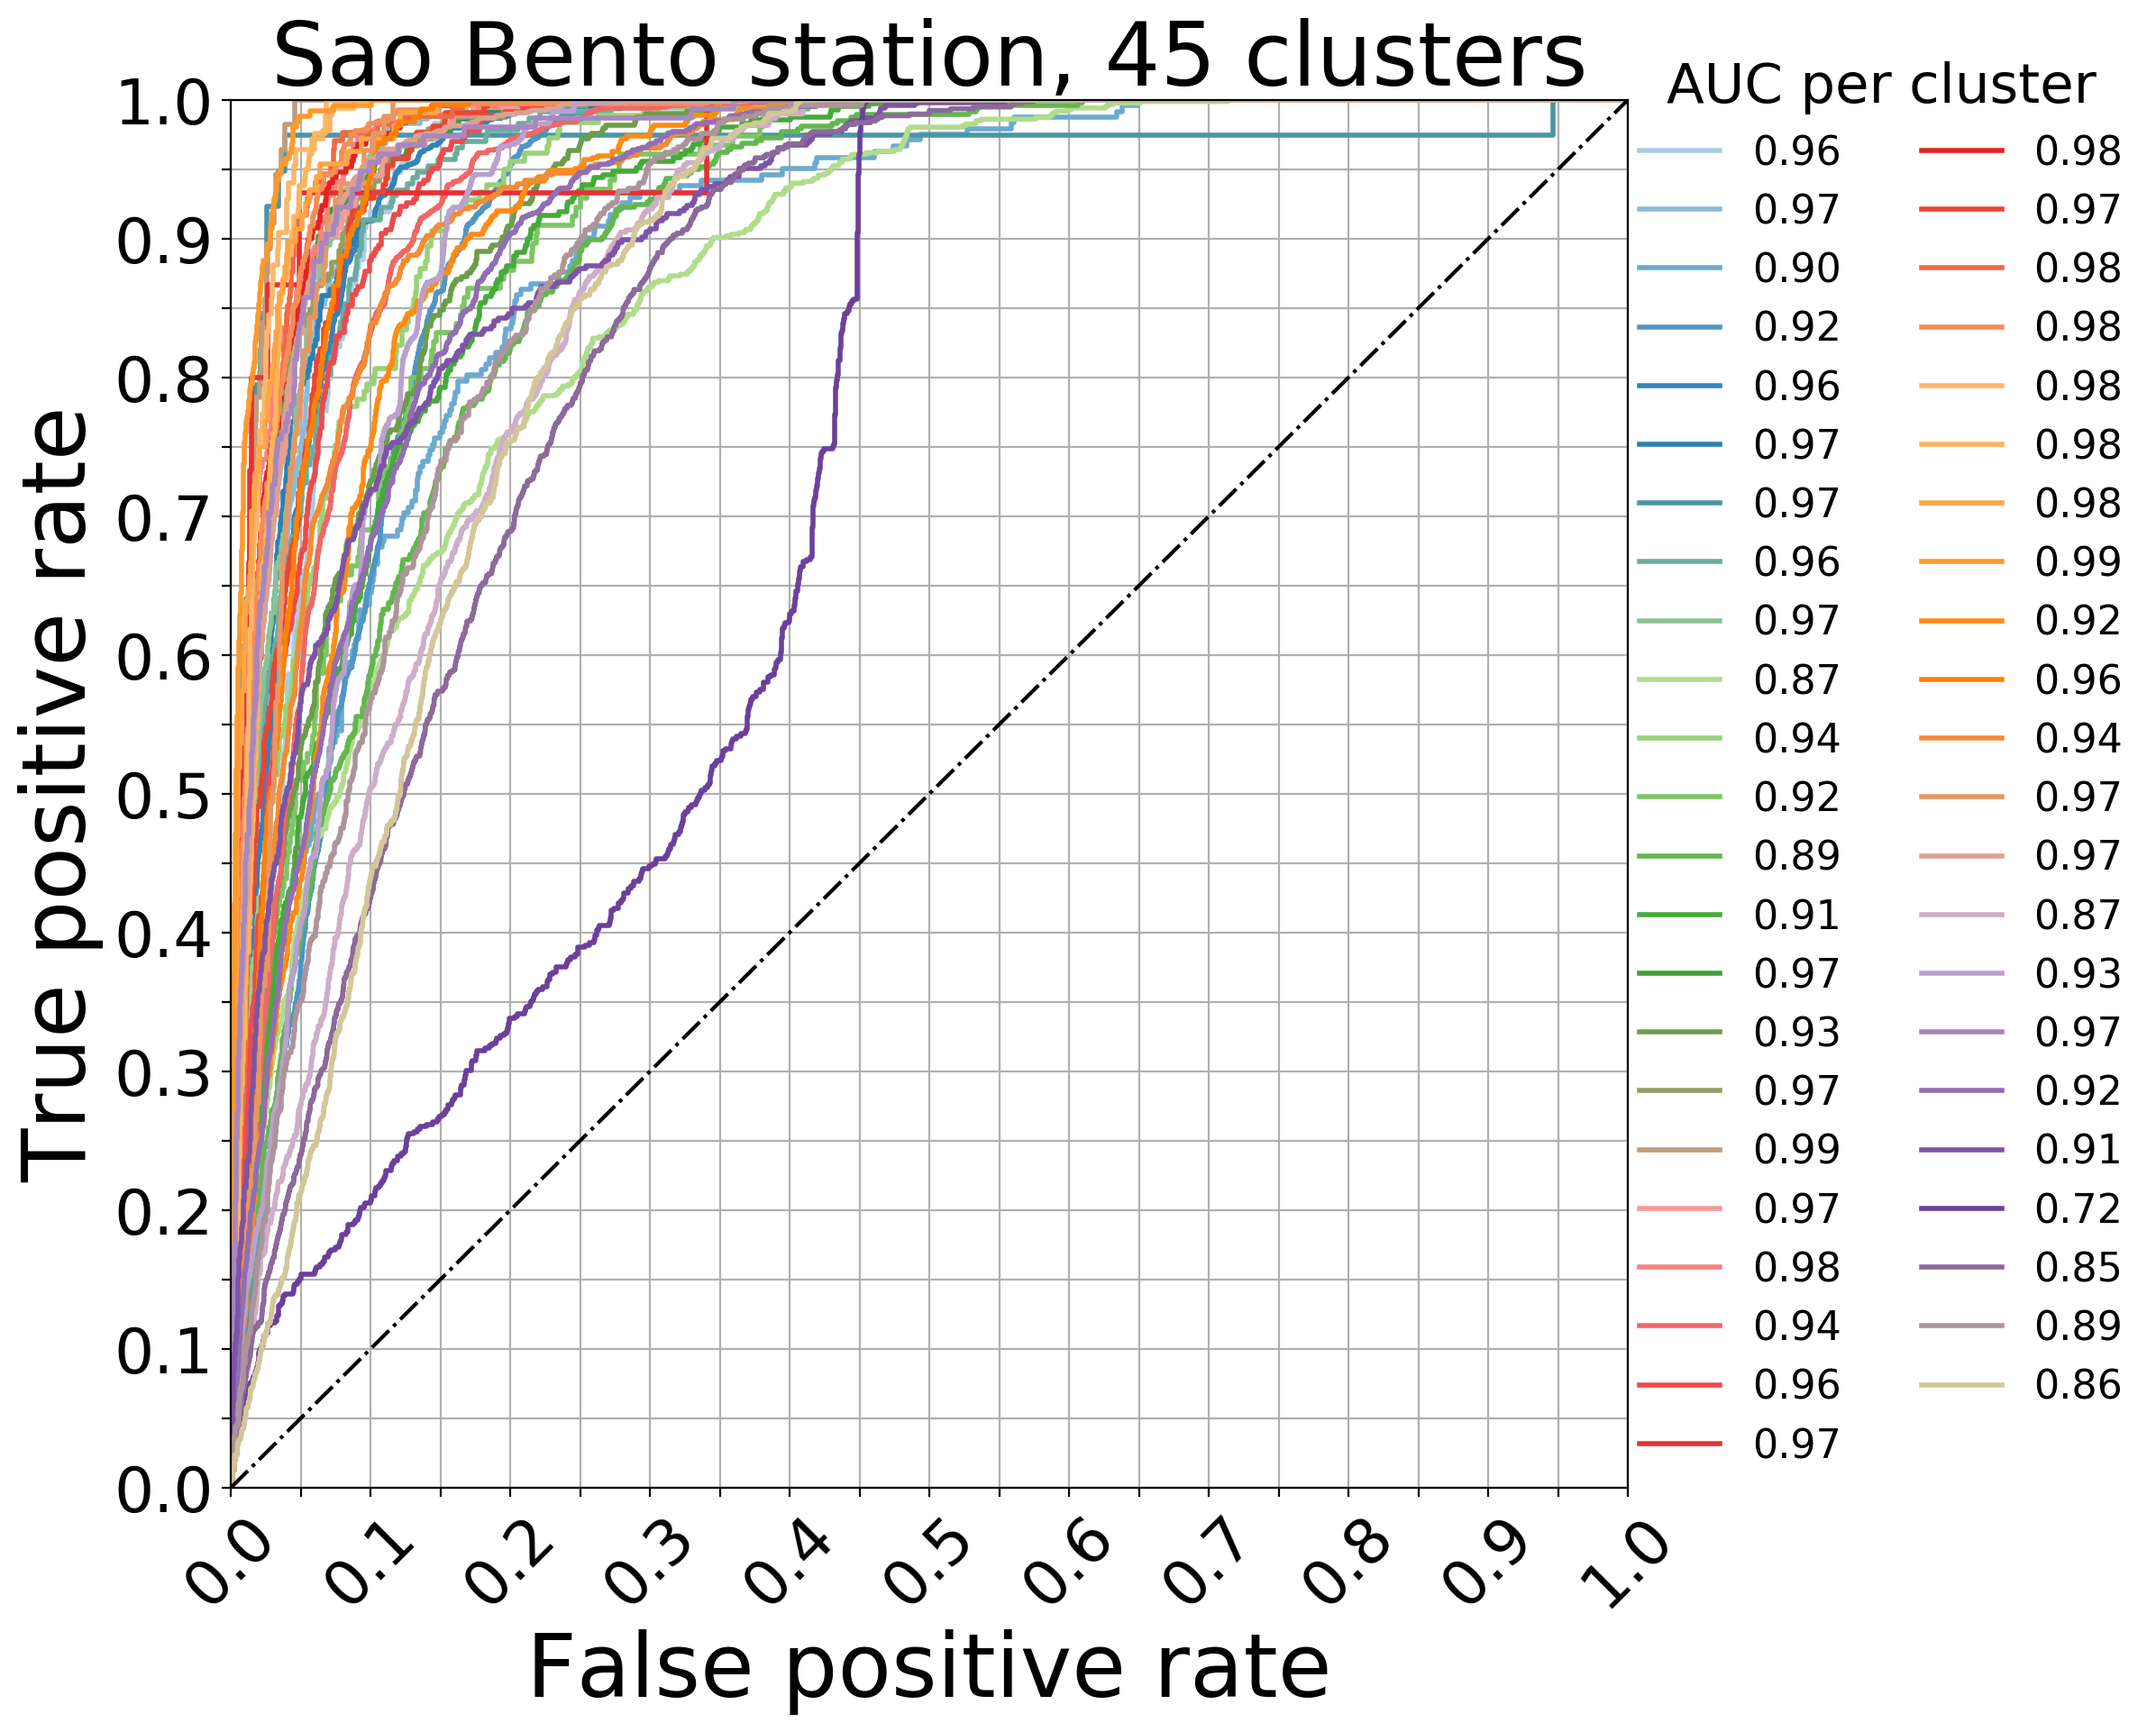
SaoBento Dataset
Percentage of well classified trajectory : 92.95
Percentage of of trajectories where good prediction are within best-3 predictions: 99.35
2/ figure_roc_curve.py : Produce the following roc curve from cross validation procedure.
- Python = 2.7.14
- pandas = 0.22.0
- numpy = 1.13.3
- traj_dist = 1.0
- matplotlib = 2.1.0
- basemap = 1.0.7
- fastcluster = 1.1.24
- scipy = 1.0.0
- [1] Besse, P. C., Guillouet, B., Loubes, J. M., & Royer, F. (2016). Review and perspective for distance-based clustering of vehicle trajectories. IEEE Transactions on Intelligent Transportation Systems, 17(11), 3306-3317.
- [2] BESSE, Philippe C., GUILLOUET, Brendan, LOUBES, Jean-Michel, et al. Destination Prediction by Trajectory Distribution-Based Model. IEEE Transactions on Intelligent Transportation Systems, 2017.
- [3] Michal Piorkowski, Natasa Sarafijanovic‑Djukic, Matthias Grossglauser, CRAWDAD dataset epfl/mobility (v. 2009‑02‑24), downloaded from https://crawdad.org/epfl/mobility/20090224, https://doi.org/10.15783/C7J010, Feb 2009.
- [4] KAGGLE data set ecml/pkdd 15: Taxi trajectory prediction (1),” Downloaded from https://www.kaggle.com/c/pkdd-15-predict-taxiservice-trajectory-i/data, Apr. 2015.
- [5] https://github.com/bguillouet/traj-dist