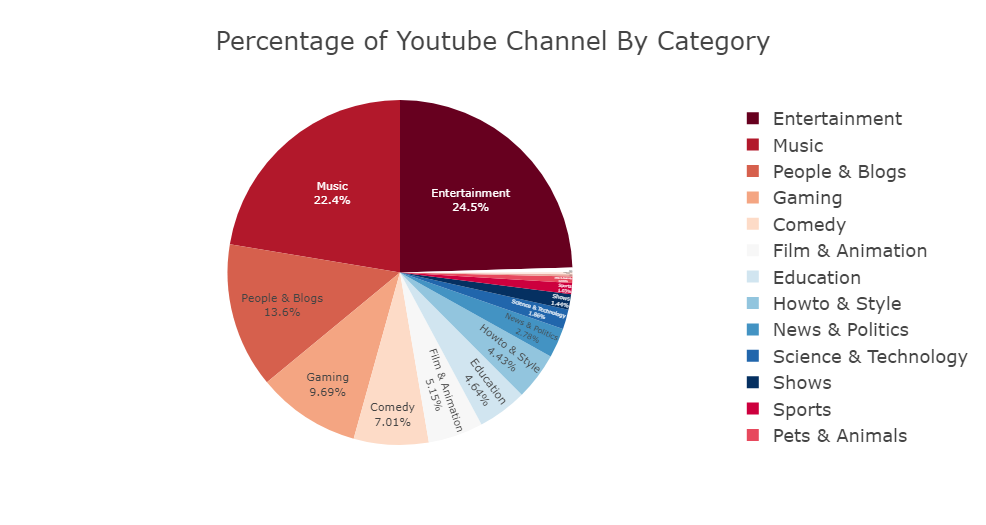
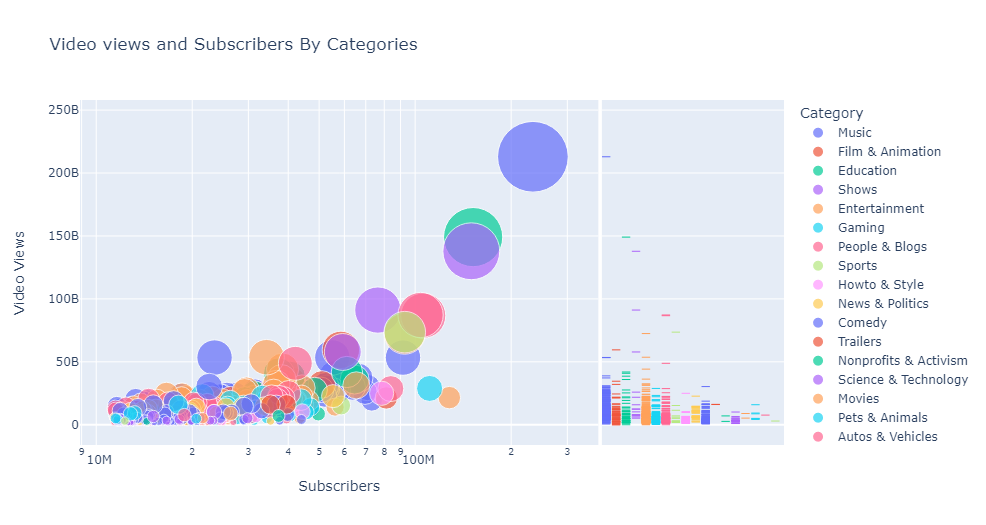
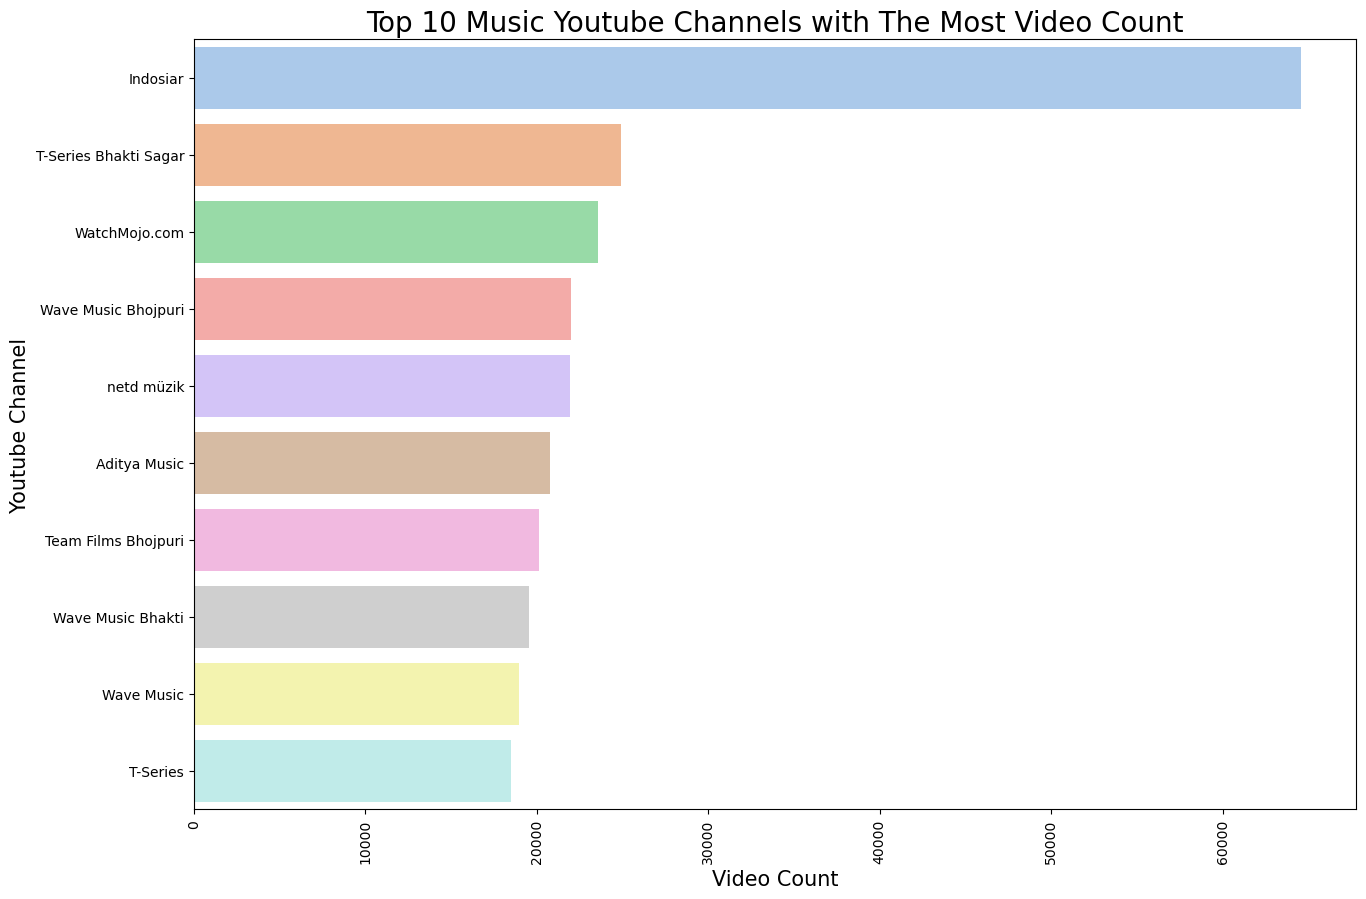
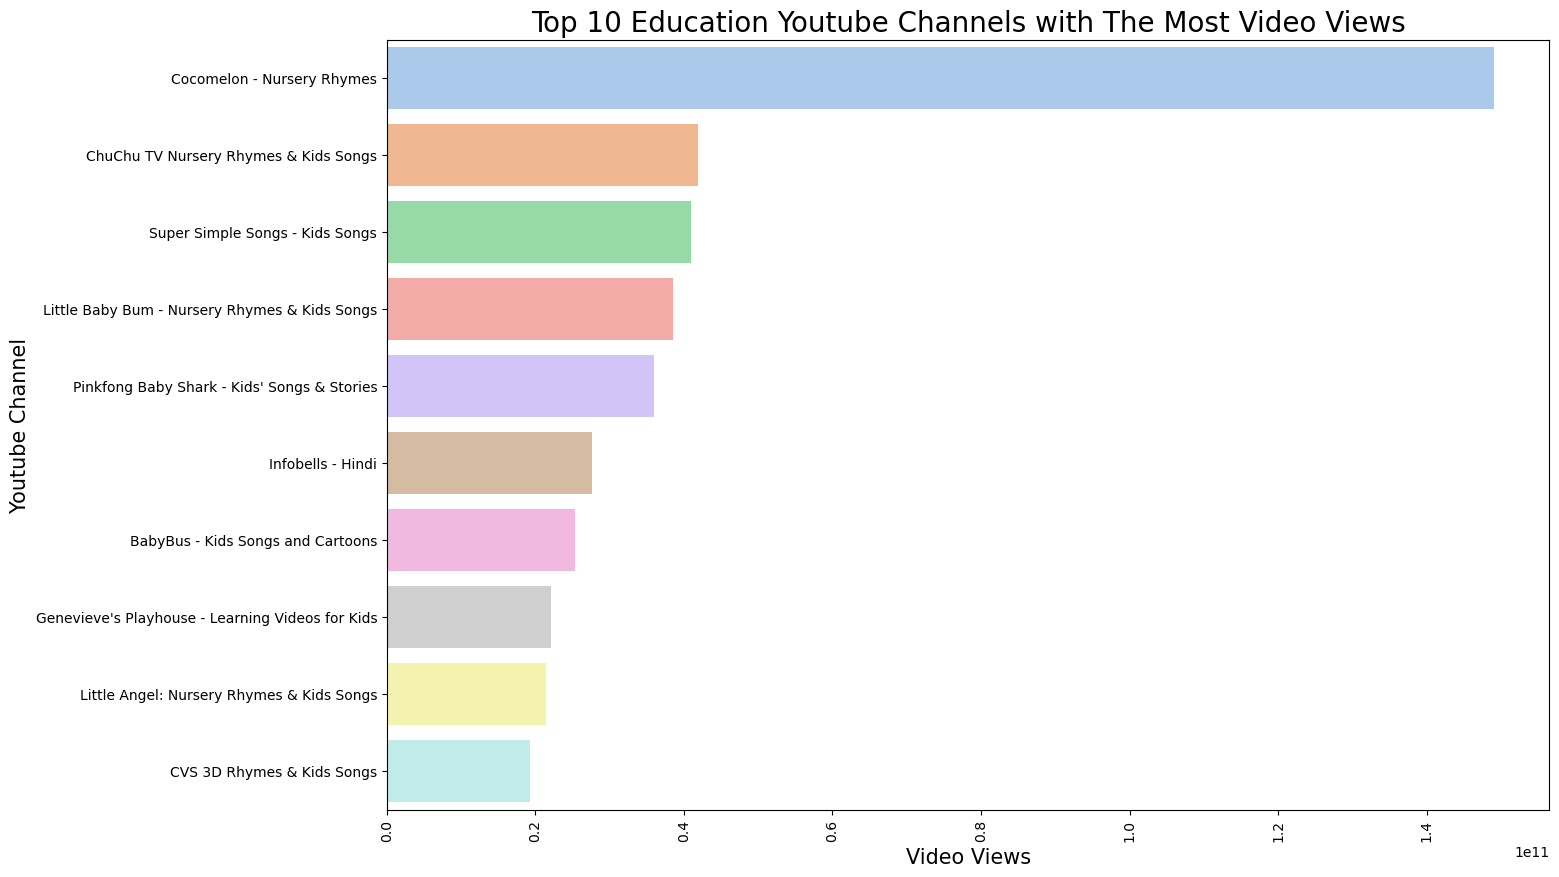
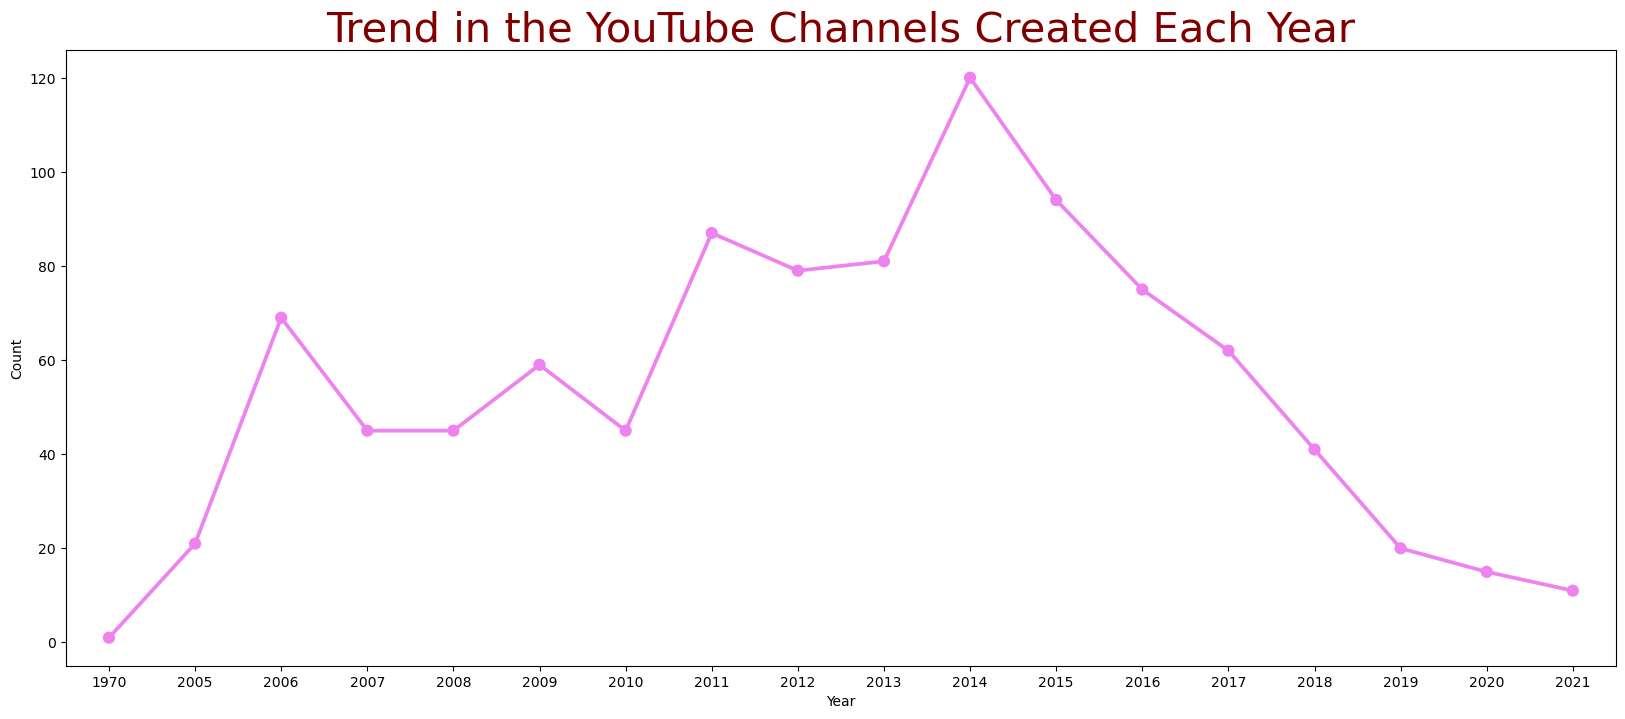
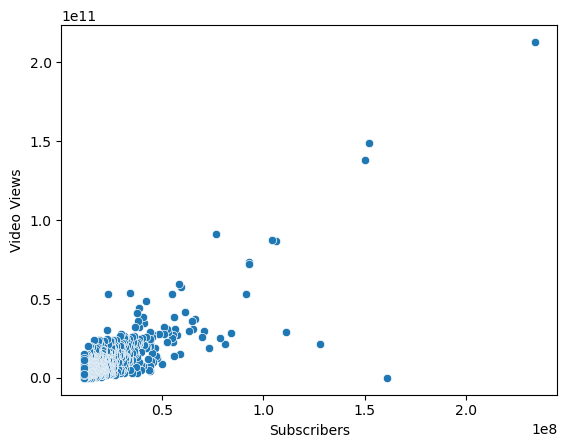
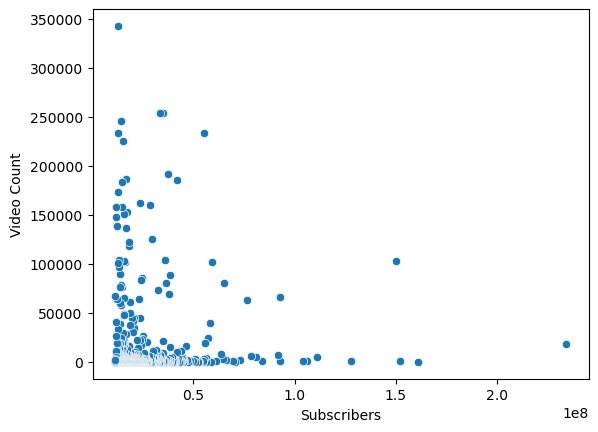
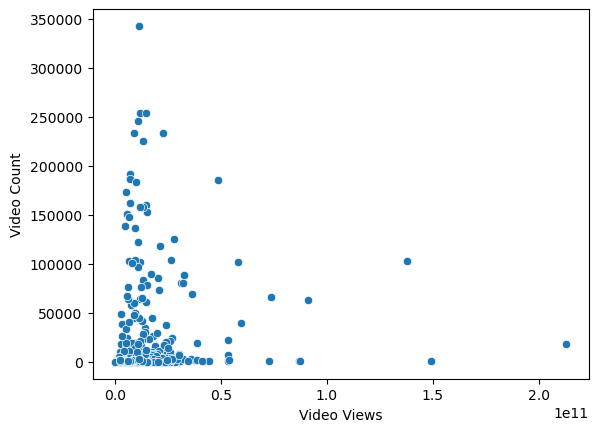
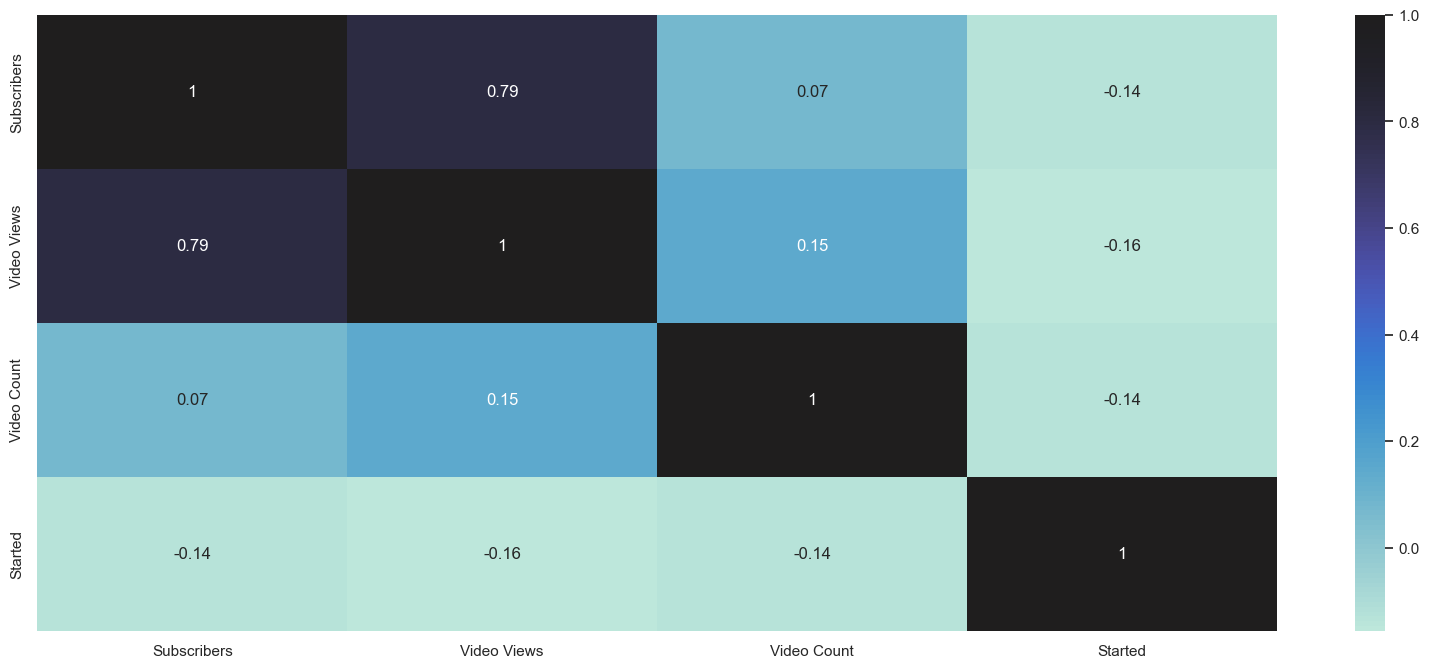
The code analyzes a dataset of the top subscribed YouTube channels, exploring their categories, subscribers, video views, and video counts. It uses visualization libraries such as Matplotlib, Seaborn, and Plotly Express to create graphs and charts that depict the data in various ways, including a pie chart of the percentage of channels by category, a scatter plot of subscribers and video views, a bar plot of the top 10 channels in the music and education categories by video count and video views, respectively, and a heatmap of the correlation between the different variables. The code also includes a point plot of the trend in YouTube channel creation by year. Overall, the code provides insights into the characteristics of top YouTube channels and how they vary by category.
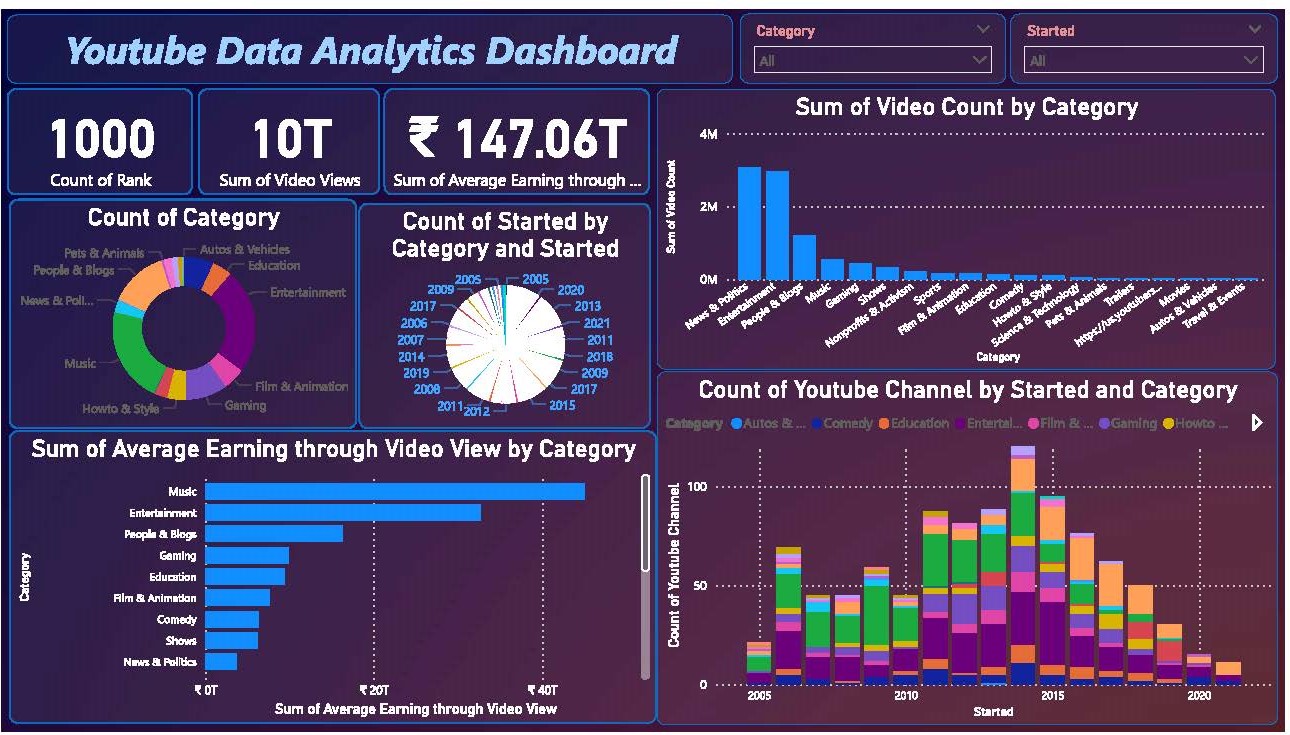
The dashboard you created on Power BI analyzes data on the top 1000 most subscribed YouTube channels. Using visualizations, you explored the categories of the channels, the relationship between subscribers, video views, and video count, and the top channels in the music and education categories.The dashboard provides valuable insights into the world of YouTube channels and their popularity across different categories. These insights can be used to inform content creation and marketing strategies for individuals and organizations looking to establish a strong presence on YouTube.
To run this project, you will need to add the following python module installation and Visual Studio Code extension
pip install numpypip install pandaspip install seabornpip install plotlypip install matplotlib
Jupyter notebook
- Data Processing
- Data Visualization
- Data Analytics
- Created interactive dashboard to track and analyze Youtube Data.
- Used complex parameters to drill down in worksheet and customization using filters and slicers
- Created connections, join new tables, calculations to manipulate data and enable user driven parameters for visualizations
- Used different types of customized visualization (bar chart, pie chart, donut chart, clustered bar chart, map, slicers, etc)