This project analyzes artist similarity using data from the Semantic Artist Similarity (SAS) Dataset. The main components of the project include:
SAS_networkx.py: Python script for building and analyzing the artist similarity network using NetworkX.SAS_D3.html: HTML file for visualizing the network using D3.js.network_datafolder: Contains saved edges, nodes, and the graph data.plotsfolder: Contains saved plots generated from the code.dataset-artist-similarityfolder: Contains data from the SAS dataset.
The data used in this project is obtained from the SAS: Semantic Artist Similarity Dataset, which consists of two datasets of artist entities with their corresponding biography texts and a list of the top-10 most similar artists within the datasets used as ground truth.
mirex_gold_top10.txtandlastfmapi_gold_top10.txt: These files contain the top-10 lists of artists for every artist in both datasets, identified by MusicBrainz ID.mb2uri_mirex.txtandmb2uri_lastfmapi.txt: These files contain the MusicBrainz ID, Last.fm name, and DBpedia URI for each artist.- Biography Texts: The biography texts of each artist are stored as
.txtfiles named with the MusicBrainz ID.
This Python script (SAS_networkx.py) is used for building and analyzing the artist similarity network. It includes the following functionalities:
- Graph Class: Represents the artist similarity network and provides methods for adding nodes, edges, calculating metrics, and visualizing the network.
- Parsing Functions: Functions to parse data from the SAS dataset and add nodes/edges to the graph.
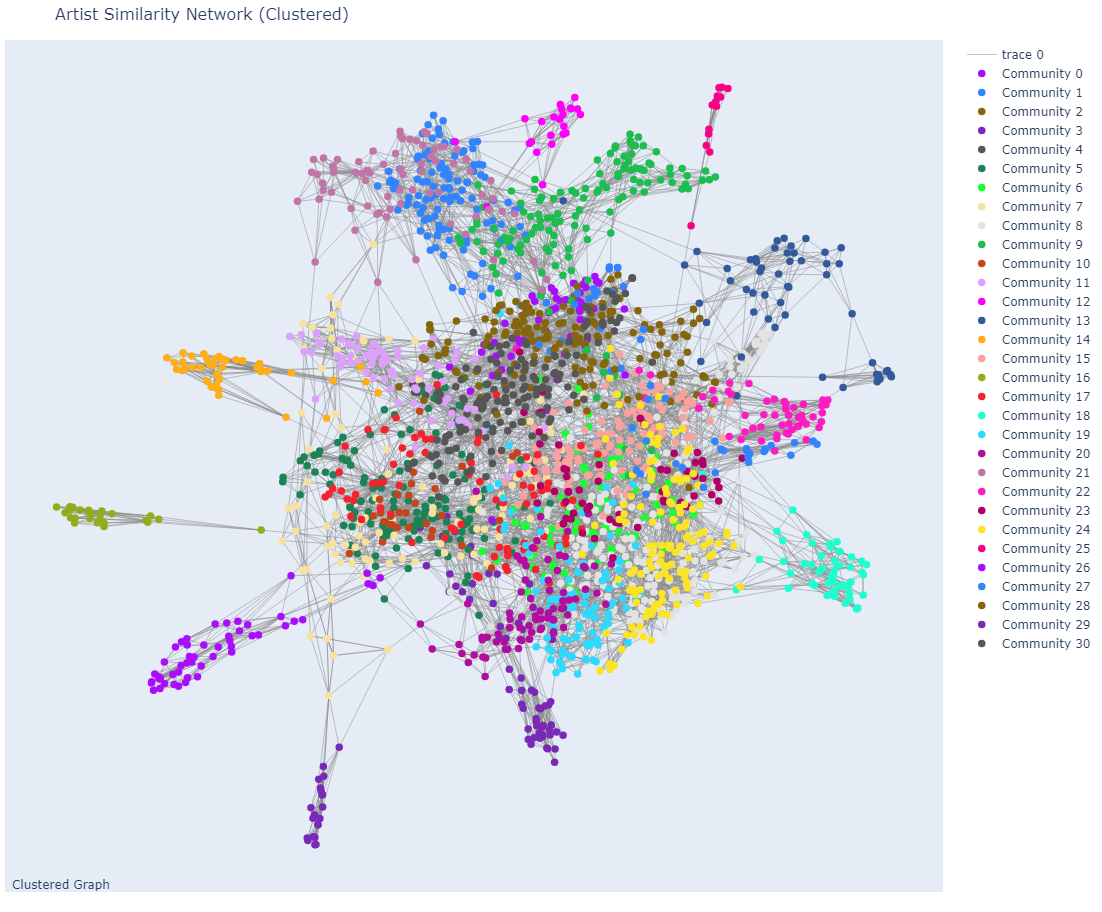
- Visualization: Functions to draw the network using NetworkX and Plotly.
- Instantiate the
Graphclass. - Parse artist and similarity data using
parse_artist_txtandparse_sim_artist_txtmethods. - Build the network and visualize it using various methods provided in the script.
- Explore network metrics such as node degrees, furthest connectivity, and shortest paths.
from SAS_networkx import Graph
# Instantiate Graph
graph = Graph()
# Parse artist and similarity data
graph.parse_artist_txt("dataset-artist-similarity/LastFM/mb2uri_lastfmapi.txt")
graph.parse_sim_artist_txt("dataset-artist-similarity/LastFM/lastfmapi_gold.txt", num_similar=5)
# Build and visualize the network
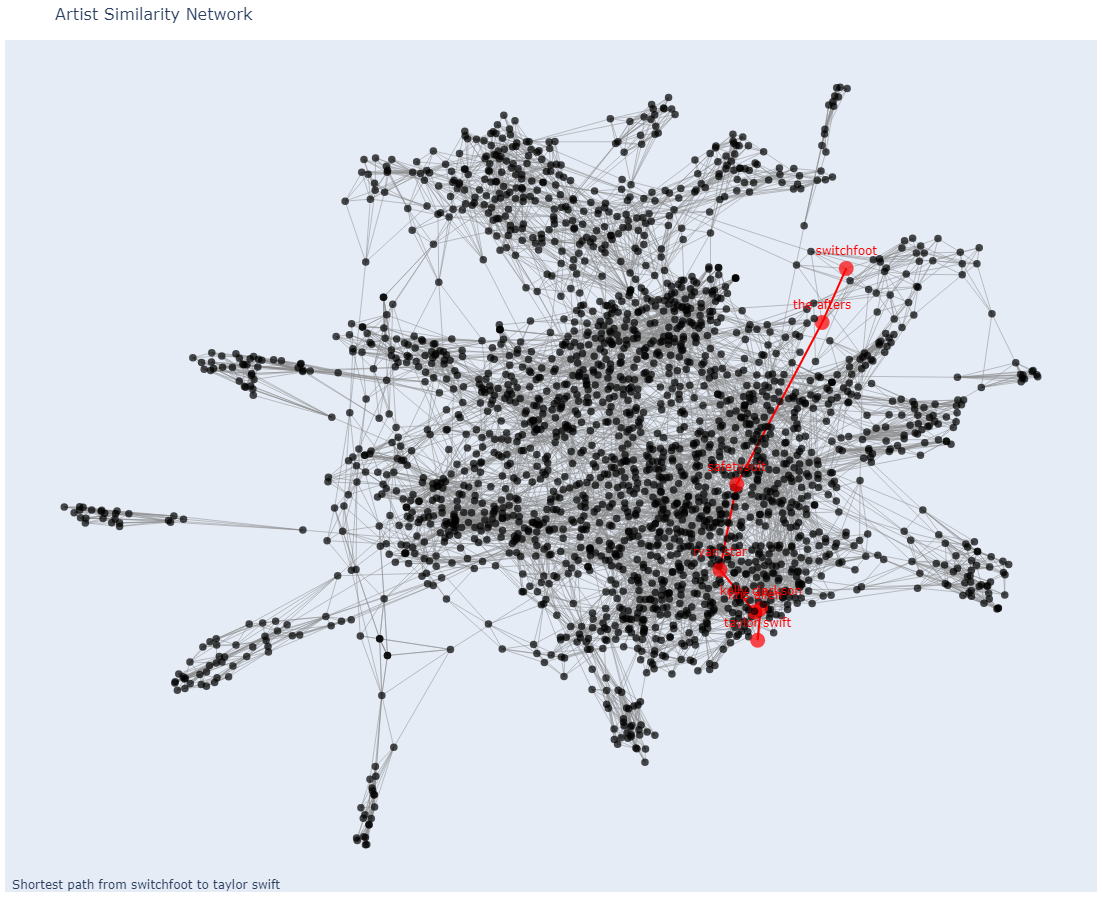
graph.add_networkx_depth('switchfoot', loops=6)
graph.draw_networkx_node(True)
# Find furthest connectivity and shortest paths
furthest_nodes, max_connectivity = graph.find_nodes_with_furthest_connectivity()
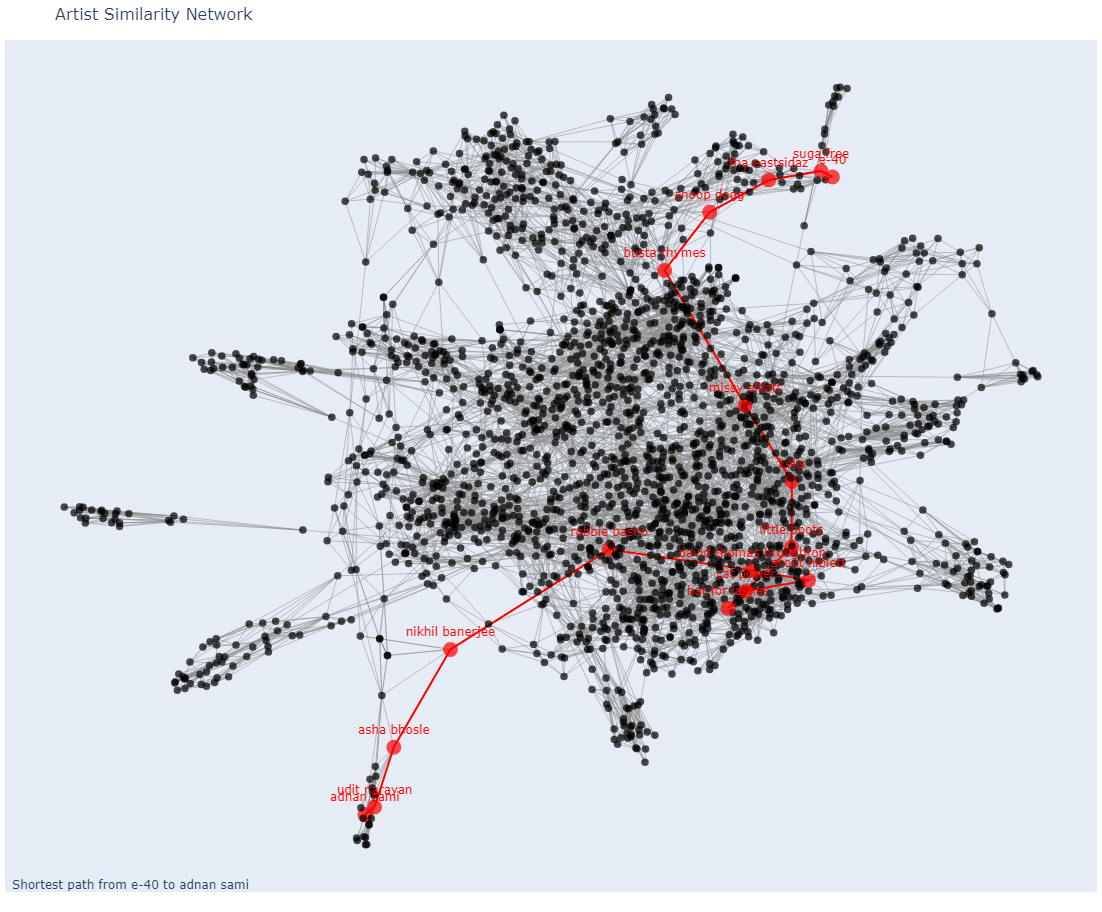
shortest_path = graph.shortest_path('adnan sami', 'e-40')
# Visualize shortest path and full network using NetworkX and Plotly
graph.visualize_shortest_path('adnan sami', 'e-40')
graph.draw_plotly_network(path=shortest_path)For detailed usage and additional functionalities, refer to the comments and docstrings within SAS_networkx.py.
This HTML file (SAS_D3.html) provides a visualization of the artist similarity network using D3.js. It loads data asynchronously, creates nodes and edges, and allows for interactive exploration of the network.
- Open
SAS_D3.htmlin a web browser. - Use the search box to find nodes by name.
- Click on nodes to highlight them.