Create plots from numbers.
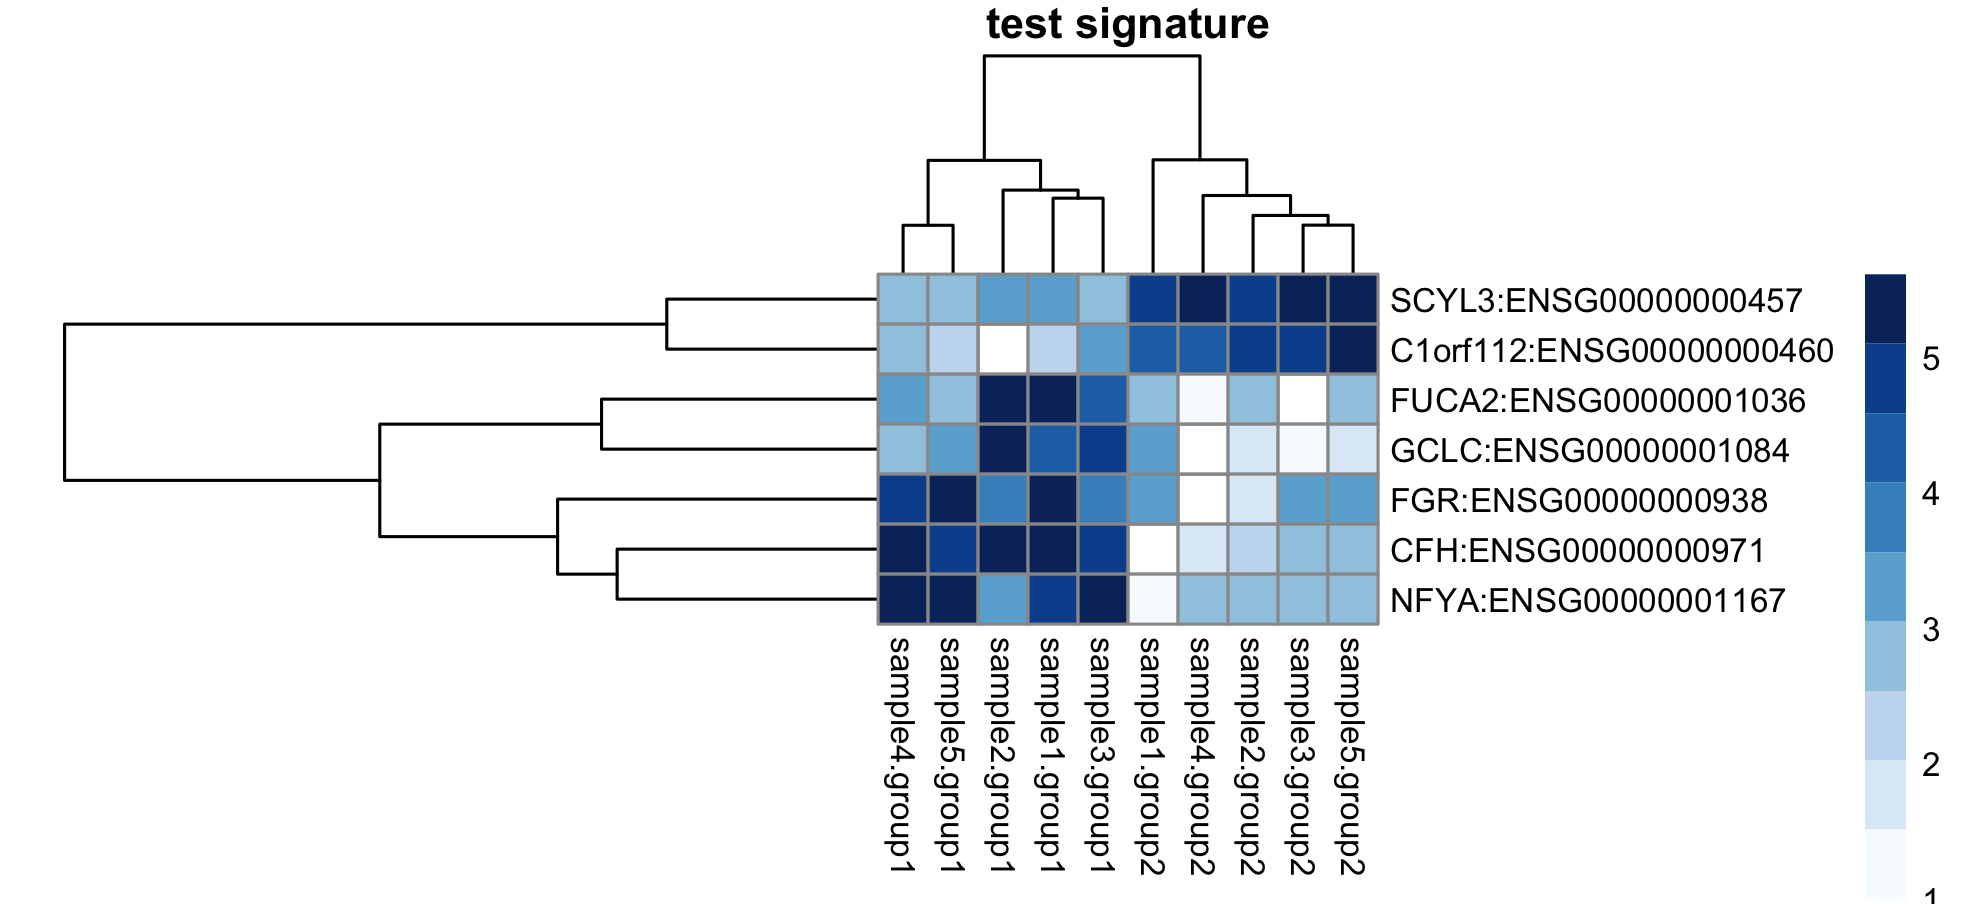
fpkm2heatmap.R creates a heatmap from expXXXX-RNAseqCounts.xlsx delivered with a RNASeq Nucleomics Core project (fake example with only 10 gene products). An arbitrary example is shown next to ilustrate a typical result. Although care was taken, some minor edits may be required to adapt to changes in column order or eliminate 'toxic' data rows.
fpkm2heatmap-cmd.R does the same but from terminal with command arguments
fpkm2heatmap-cmd.R -h
Usage: ./fpkm2heatmap-cmd.R [options] file

Options:
	-i INFILE, --infile=INFILE
		input file name [REQUIRED]

	-s SIGNATURE, --signature=SIGNATURE
		signature file name (if absent, all data will be plotted)

	-o OUTFILE, --outfile=OUTFILE
		base name for output [default: full_heatmap]

	-f OUTFORMAT, --outformat=OUTFORMAT
		file format for output 1:PNG, 2:PDF [default: 1]

	-h, --help
		Show this help message and exit
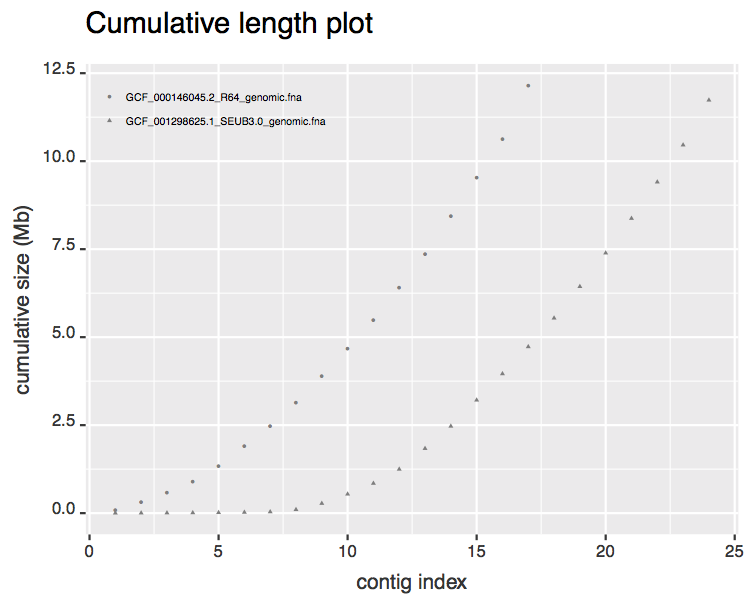
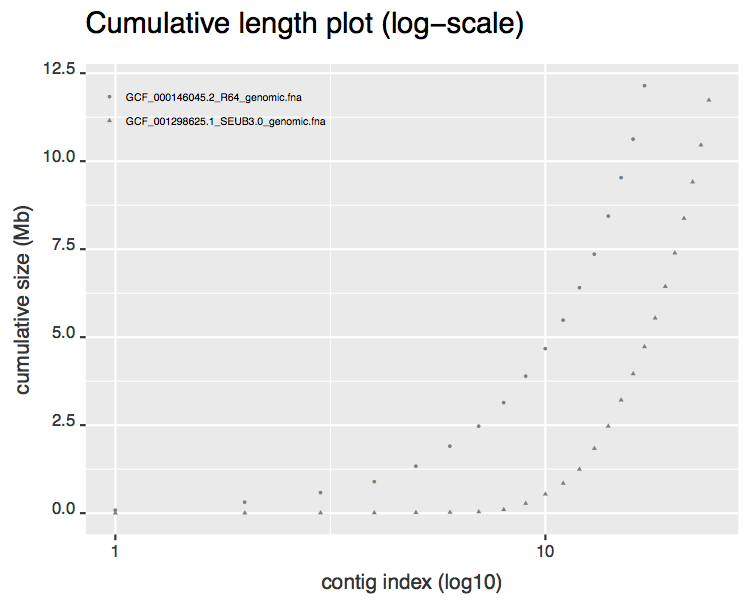
lendist.R creates two plots from one or more fasta assembly files. The plots report the cumulative sum of the contigs/chromosomes present in each fasta to illustrate assembly improvement.
Please send comments and feedback to [email protected]

This work is licensed under a Creative Commons Attribution-ShareAlike 3.0 Unported License.