


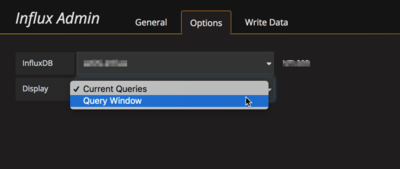
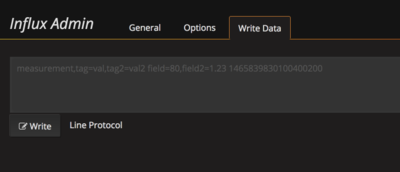
This panel duplicates features from the now depricated Web Admin Interface.
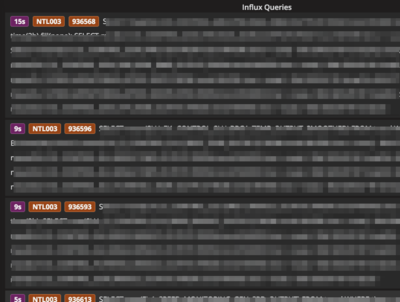
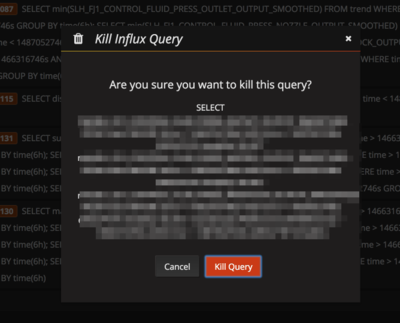
This panel lets you see the currently running queries and easily kill them.
This plugin expects there to be at least one InfluxDB datasource configured.
To complie, run:
npm install -g yarn
yarn install --pure-lockfile
yarn build
- Removing
distfrom the master branch - adding circleci build
- convert to webpack
- Now supports $timeFilter in query
- Now supports datasource defined as a template variable
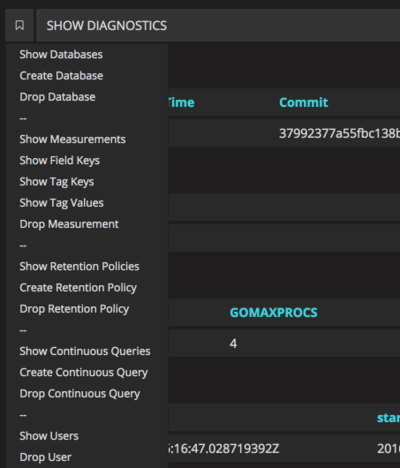
- Added more debug query templates
- Fix write request bug
- Support Grafana 5+
- Fix issue always showing query results
- When there is only one row, swap rows/cols (ie: SHOW DIAGNOSTICS)
- Improve auto-refresh behavior.
- Show 'message' response. (ie: please use POST)
- Fix query time sorting
- show 'status' field (killed, etc)
- Converted to typescript project based on typescript-template-datasource
- Select Databases. This only works with PR#8096
- Added time format options
- Show tags from response
- Support template variables in the query
- Save the configuration properly
- First working version