- author(s): Xing Huang, Xiaoguang Zeng, Xiaohan Yu, Lucy Li
- date created: 05/11/22
Project Objective: Follow the Kimball Lifecycle to design and develop a public, cloud-based Data Warehouse with a functioning BI Applications
Project Tools: The tools used to build this Data Warehouse were: (change this to make it applicable to your project)
- For data integration - python
- For data warehousing - Google BigQuery
- For Business Intelligence - Tableau
Motivation for the project: According to ABC News, over 37 people died from January 2021 to July 2021 after being hit by NYC trains. 30 people were shoved onto tracks and countless were injured (Deliso, 2022). Calls have grown among New Yorkers after another victim was fatally shoved onto the subway tracks in front of an oncoming train in January 2022. It is in demand for the MTA to revisit the idea of installing protective barriers in New York train stations. Considering MTA’s limited budget, we will run a series of analyses to find which 10 New York City subway stations need subway platform doors the most.
We will use MTA 2020’s Turnstile Data to find the top 10 New York City subway stations with the most ridership to install subway platform doors. We will also take a look at NYC 2020’s For-Hire Vehicle Trip Record Data to observe if there is any overall association or trend between subway ridership and for-hire vehicle ridership. We wish to direct part of them back to MTA’s service by installing platform doors, with the assumption that better subway infrastructure can increase subway ridership. Our goal is to make New York residents feel safer about taking the subways, promoting subway ridership, as well as bringing down subway crime.
Description of the issues or opportunities the project will address: Installing safety subway platform barriers would prevent riders from being pushed onto tracks. Other than the purpose of protecting more lives, it will help New York City’s economy by increasing MTA’s revenue. Because installing safety barriers will lower the fear of NYC residents taking subways, more people will return to MTA from for-hire vehicle companies.
Project Business or Organization Value: The project can promote New York subway ridership and bring down subway crime which will bring a beneficial impact on New York City’s economy. We estimate this project will increase MTA’s revenue by 5% in the first year after installing platform doors in 10 major subway stations. This project will also protect more New York residents from subway crime, making them feel safer about living in New York, and preventing people from escaping New York City.
Data Sources:
- NYC MTA 2020 Subway Traffic Volume
- NYC 2020 High Volume FHV Trip Records
List of Data Warehouse KPIs:
- Subway Average Daily Traffic Volume per Station
- Subway Year Total passengers per Borough
- Total Traffic Volume per Month
- For-hire vehicle daily average ridership by Neighborhood
- For-hire vehicle ridership per month
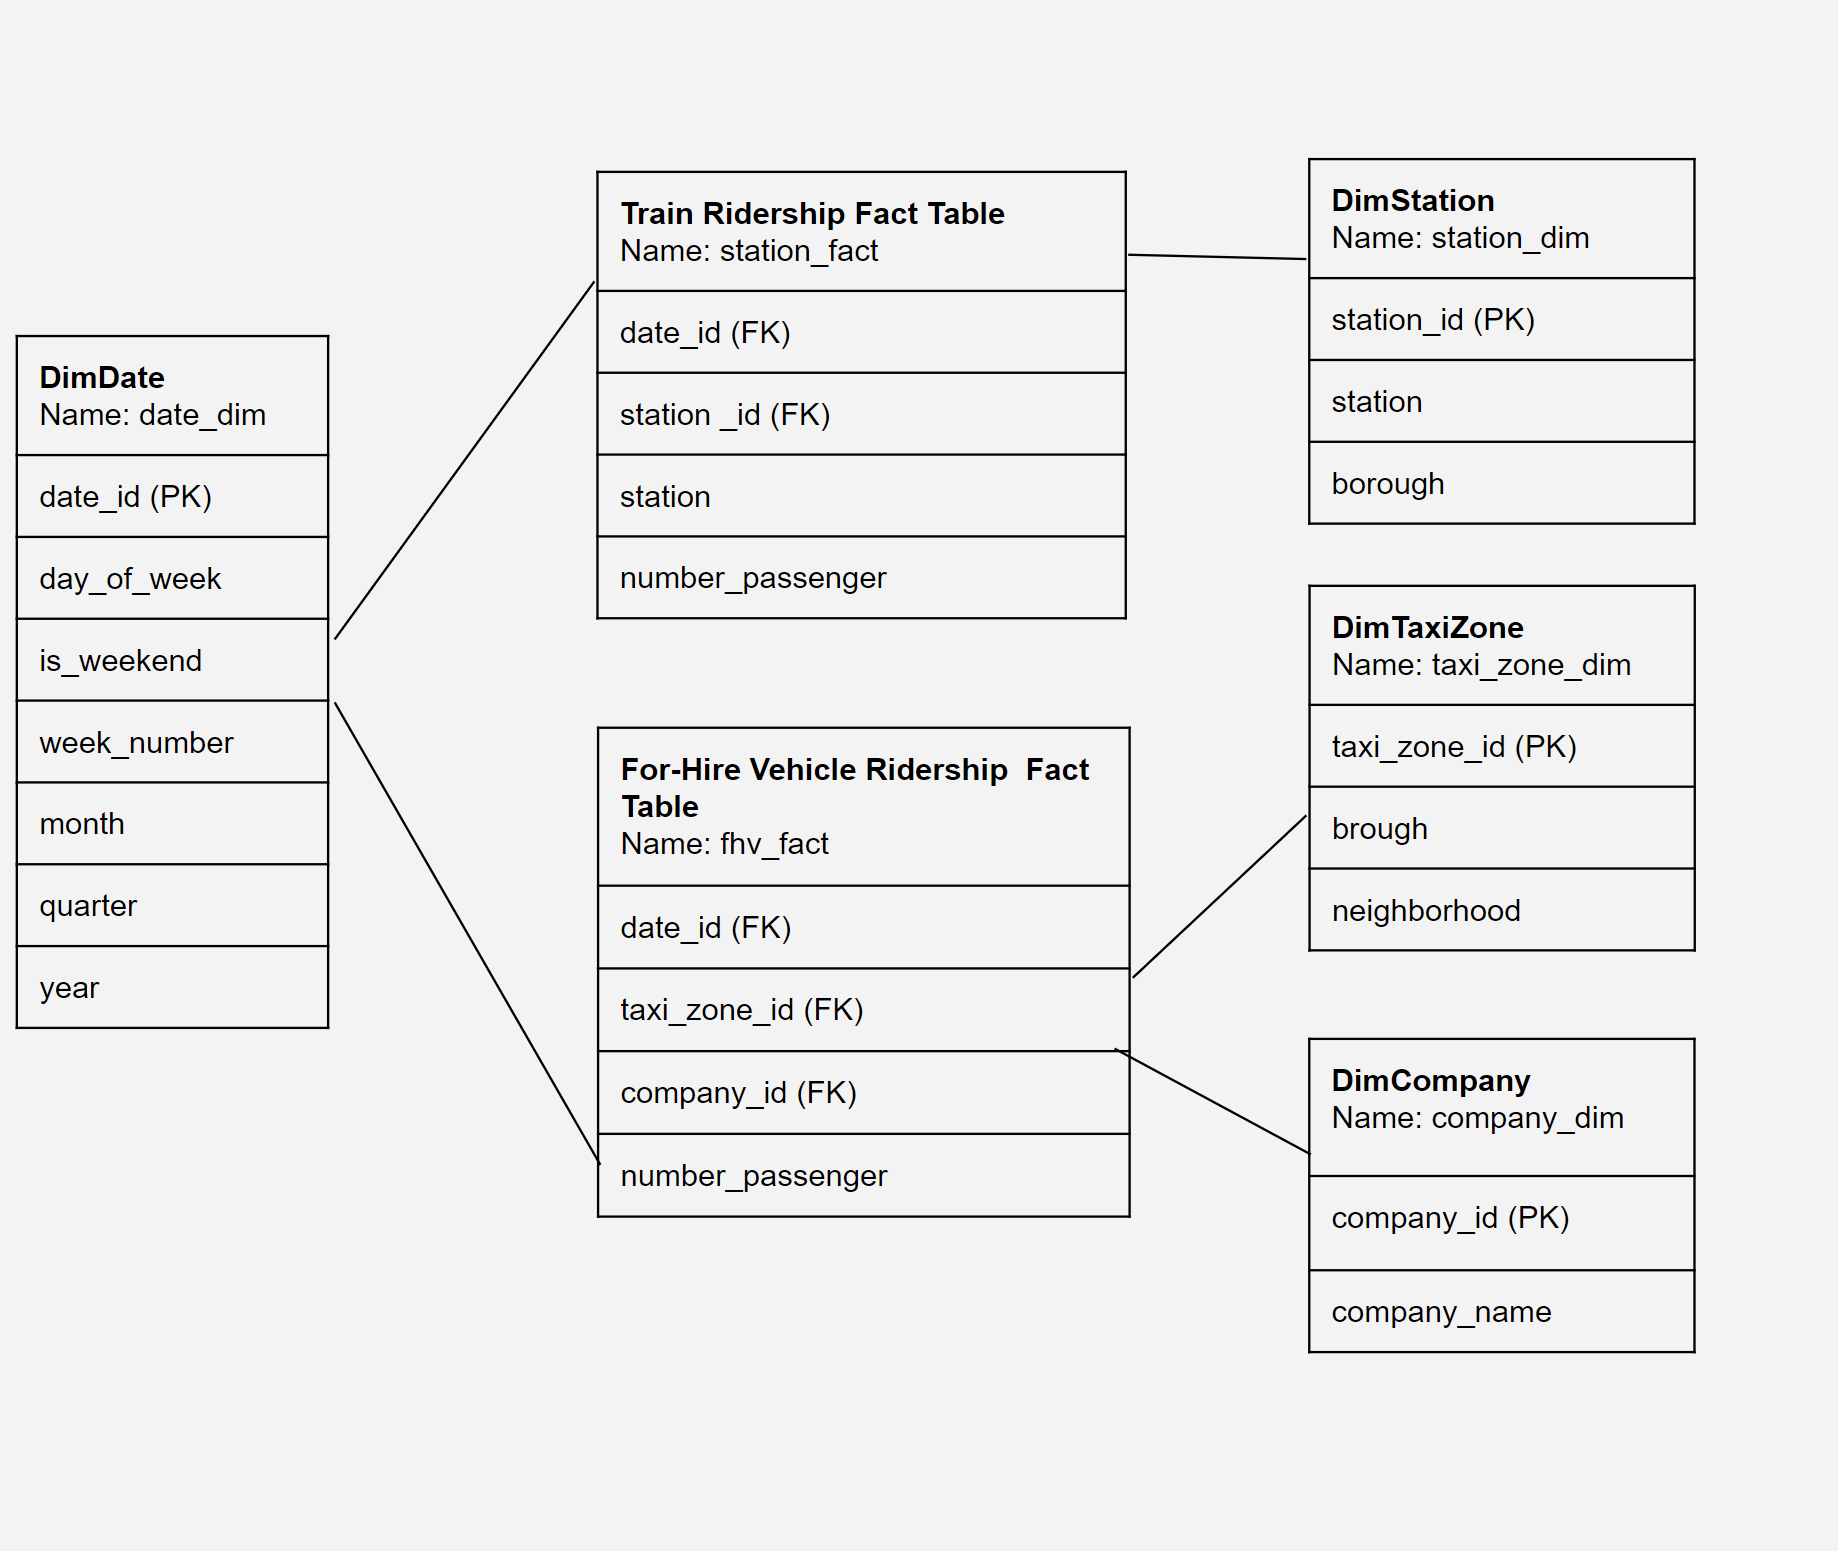
This project's Dimensional Model consists of (2) Facts and (5) Dimensions
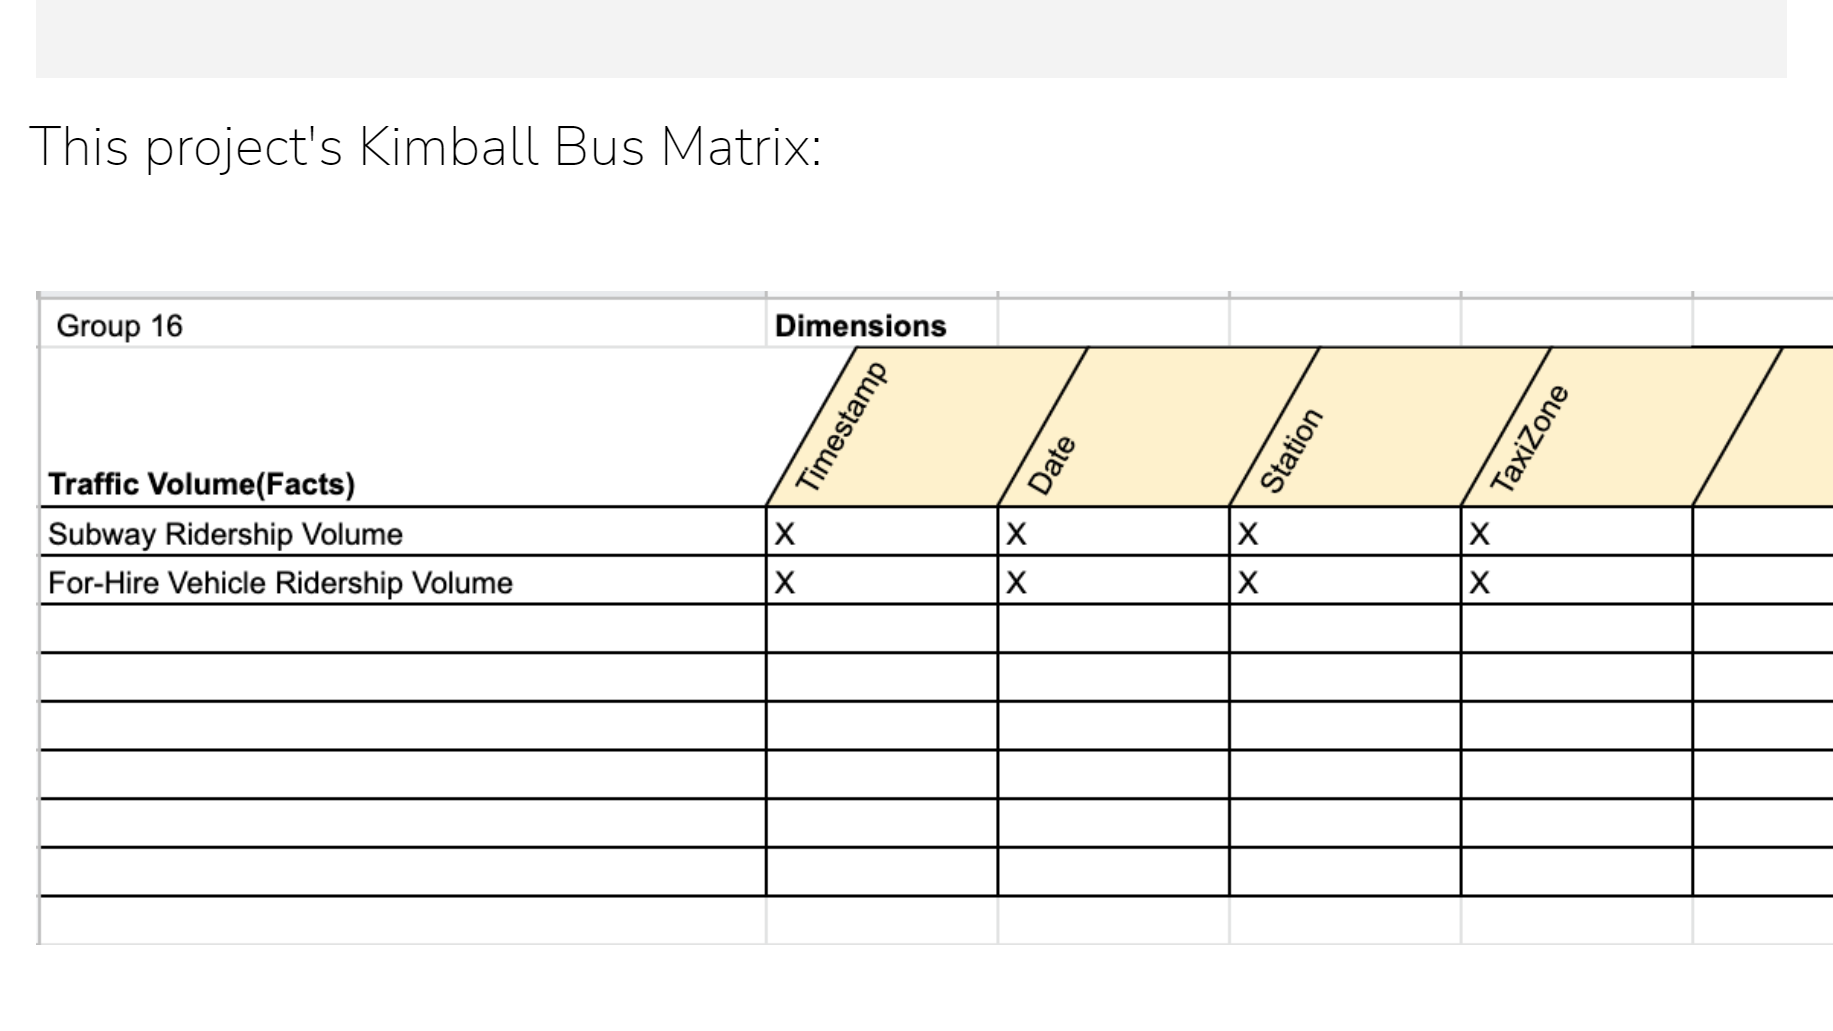
This project's Kimball Bus Matrix:
List of Visualizations for each KPI:
- Ranked horizontal bar chart for the comparison of train station's daily average traffic volume to the traffic volume of each station
- Bar Chart to compare the annual total subway ridership between boroughs
- Line charts to show the overall change in the number of ridership throughout 2020
- Ranked horizontal bar chart to compare the daily average of for-hire vehicle ridership in each neighborhood
- Area chart for the comparison of for-hire vehicle ridership per month
BI Application Wireframe design:

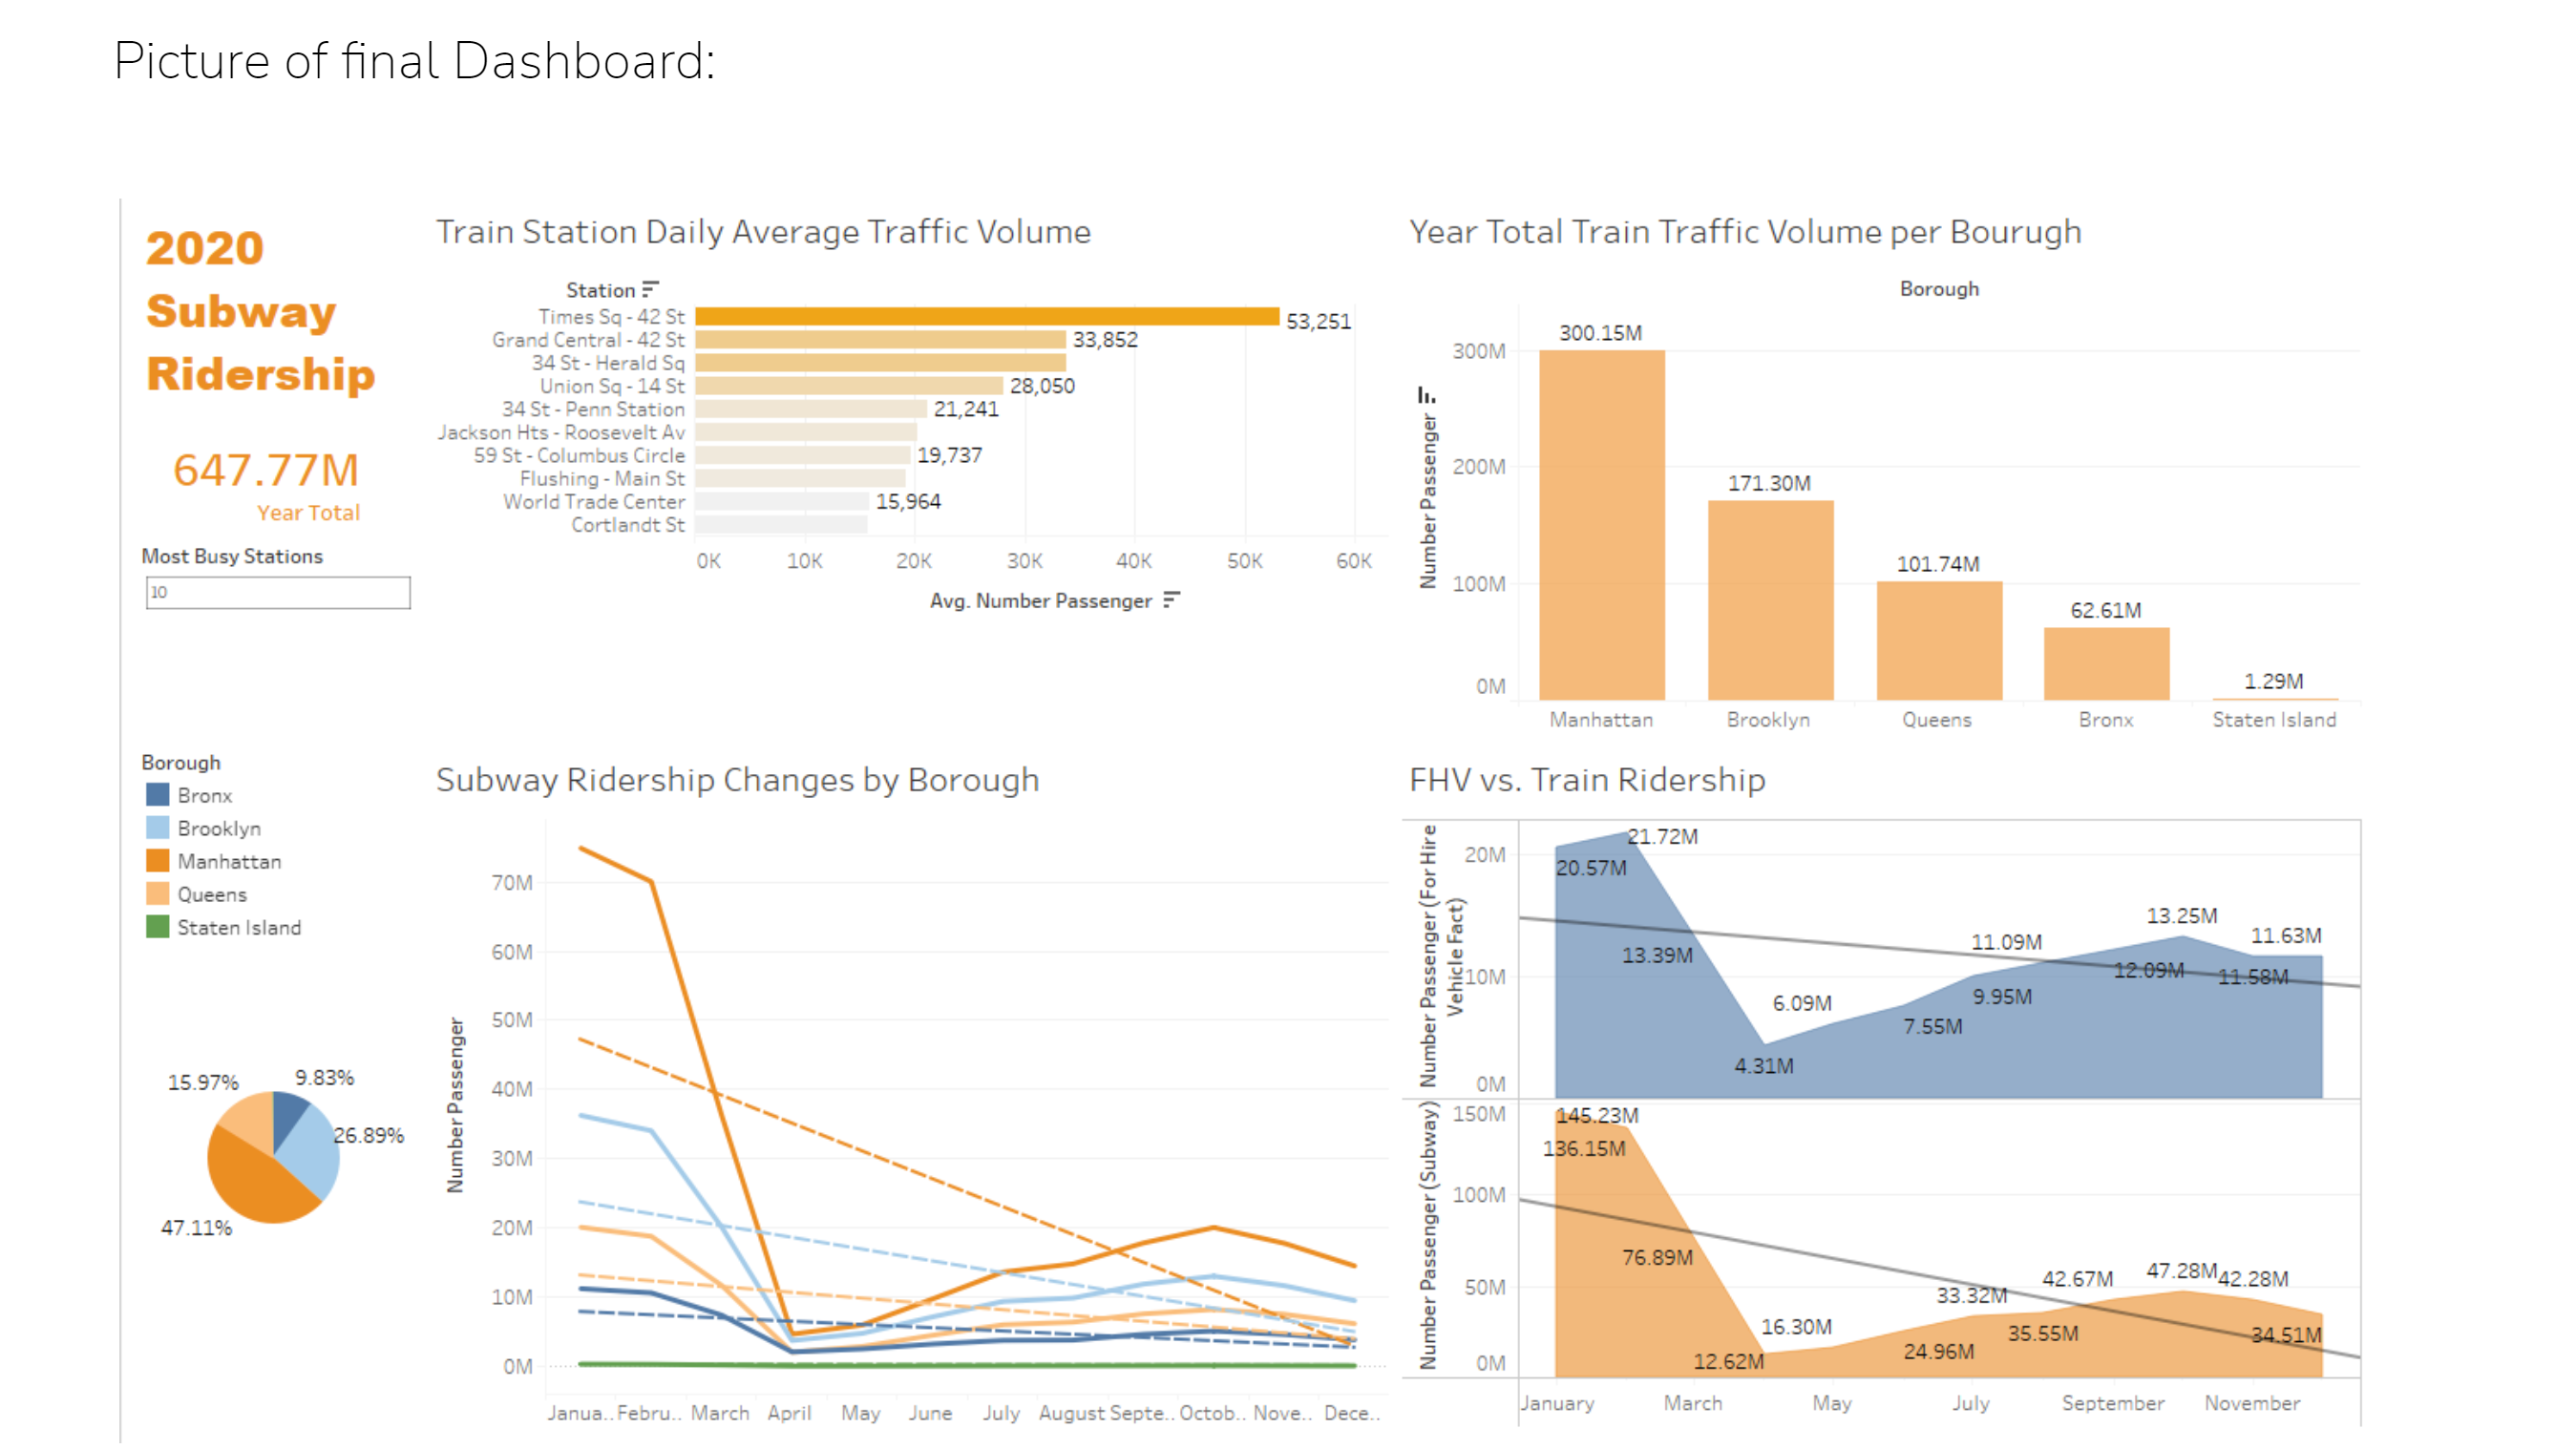
Picture of final Dashboard:

The project was deployed on Tableau Public: (link here) 1.https://public.tableau.com/app/profile/xiaohan.yu/viz/dashboard_16517199179900/subway2020?publish=yes 2. https://public.tableau.com/app/profile/xiaohan.yu/viz/dashboard_16517199179900/fhv2020