This is a Stock Market Prediction using Machine Learning and Linear Regression Model. You can choose whatever CSV Stock File to predict as long they have dates and your target prediction. I recommend downloading historical stock price data at Yahoo Finance. Below is a presentation about the whole process of coding this project.
- Choosing Dataset Wisely
- Preprocessing Data
- Linear Regression Model
- Training Multiple Models
- Save Regression Model
- Prediction
- Evaluation
- Recommended Resources
Why do I need a data set?
ML depends heavily on data, without data, it is impossible for an “AI” to learn. It is the most crucial aspect that makes algorithm training possible… No matter how great your AI team is or the size of your data set, if your data set is not good enough, your entire AI project will fail! I have seen fantastic projects fail because we didn’t have a good data set despite having the perfect use case and very skilled data scientists. -- Towards Data Science
In conclusion, we must pick dataset that is good for our Linear Regression Model. If I choose AAPL Stocks from 1980 to now...

Figure 1: APPL Stocks from 1980 to 2020

And if I use r2_score (from sklearn.metrics import r2_score) to calculate the r^2 score for our model, I get 0.53 accuracy which is horrible!
In the end, I decided to start our model from 2005 to this current year, which is 2020 and fit a regression line to it, and this is the result:

In any Machine Learning process, Data Preprocessing is that step in which the data gets transformed, or Encoded, to bring it to such a state that now the machine can easily parse it. In other words, the features of the data can now be easily interpreted by the algorithm. -- TowardsDataScience
There is a lot of preprocessing data techniques , I recommend this article from TowardsDataScience.
For this project, I have impute NaN(Not a Number) values I saw at the CSV File. We can check whether any of the element is NaN by executing this code: np.any(np.isnan(mat)) which will then output which of the column(s) have NaN value(s) and remove them: x[np.isnan(x)] = np.median(x[~np.isnan(x)])
In statistics, linear regression is a linear approach to modeling the relationship between a scalar response (or dependent variable) and one or more explanatory variables (or independent variables). The case of one explanatory variable is called simple linear regression. --Wikipedia
A simple linear regression equation is y=mx+b, whereas m is the slope/gradient of the polynomial of the line aka y( predict coefficient) and b is the intercept of the line (bias coefficient).

Simple linear regression is when one independent variable is used to estimate a dependent variable which is what I use for this project. .
When more than one independent variable is present the process is called multiple linear regression。
The key point in the linear regression is that our dependent value should be continuous and cannot be a discrete value. However, the independent variables can be measured on either a categorical or continuous measurement scale. -- Machine Learning With Python By IBM
Before we fit our data into the model, we must convert them(date and prices) to numpy arrays np.asanyarray(dates) and reshape np.reshape(dates,(len(dates),1)) them as sklearn only accept numpy array or sparse matrix.
After that, we need to split our dataset to train data and test data in order to get more accurate evaluation on out of sample(data that didn't train on) accuracyxtrain, xtest, ytrain, ytest = train_test_split(dates, prices, test_size=0.2). I advise to not train and test on the same dataset as it would cause high variance and low bias
reg = LinearRegression().fit(xtrain, ytrain)
The cons of train_test_splitis that the it's highly dependant on which dataset is trained and tested. One way to approach this problem is to train multiple models and get the highest accuracy model.
best = 0
for _ in range(100):
    xtrain, xtest, ytrain, ytest = train_test_split(dates, prices, test_size=0.2)
    reg = LinearRegression().fit(xtrain, ytrain)
    acc = reg.score(xtest, ytest)
    if acc > best:
    best = acc
When dealing with Machine Learning models, it is usually recommended that you store them somewhere. At the private sector, you oftentimes train them and store them before production, while in research and for future model tuning it is a good idea to store them locally. I always use the amazing Python module pickle to do so. -- TowardsDataScience
with open('prediction.pickle','wb') as f:
    pickle.dump(reg, f)
    print(acc)
pickle_in = open("prediction.pickle", "rb")
reg = pickle.load(pickle_in)
We can predict stock prices by parsing a date integer. For instance, we want to predict the price stock for tomorrow (considering we downloaded dataset today), we can excecute this line of code:
reg.predict(np.array([[int(len(dates)+1)]]))
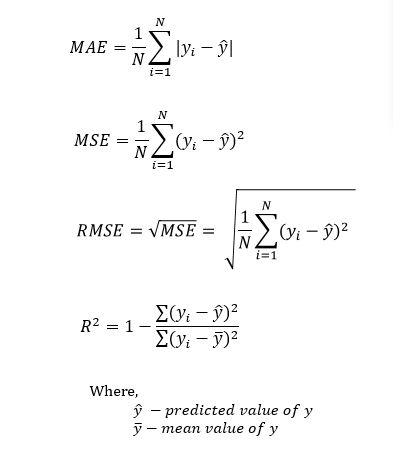
There are several evaluation methods, I recommend to read this article
As for the R² metric, it measures the proportion of variability in the target that can be explained using a feature X. Therefore, assuming a linear relationship, if feature X can explain (predict) the target, then the proportion is high and the R² value will be close to 1. If the opposite is true, the R² value is then closer to 0. -- TowardsDataScience
(Sources: datatechnotes)
reg.score(xtest, ytest)
from sklearn.metrics import r2_score
r2_score(ytest, reg.predict(xtest))
I have compiled a list of resources in the field of AI. Let me know some other great resources on AI, ML, DL, NLP, CV and more by email! :)
- Machine Learning Mastery
- TowardsDataScience
- Wikipedia
- FreeCodeCamp
- Machine Learning by Stanford (Great Course)
- Machine Learning by IBM
- Udacity Intro to Machine Learning
- Sentdex
- Siraj Raval
- MIT OpenCourseWare
- MIT Deep Learning 6.S191
- Deep Learning Specialization
- Tensorflow in Practice
- Scikit Learn
- Tensorflow
- Pytorch
- Keras
- Kaggle