In this assignment, an interactive dashboard was built to explore the Belly Button Biodiversity dataset, which catalogs the microbes that colonize human navels in JSON format.
The dataset reveals a small handful of microbial species (also called operational taxonomic units, or OTUs, in the study). Demographics information is dynamically populated based upon a user-selected test subject ID.
A bar chart, bubble chart, and a bonus gauge chart further update once the ID is changed. This code has been written using Plotly, JavaScript, HTML, CSS, and D3.js.
The task was to retrieve test subject demographics and draw a bar chart and bubble chart displaying each individual's samples. This assignment was done as follows:
- Read in samples.json using the D3 library.
- Retrieve metadata info for each test subject and display this in the form of an unordered list item as a key-value pair on the dashboard.
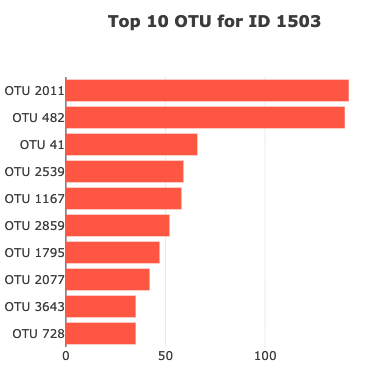
- Get required data for plotting, including sample_values, otu_ids, and otu_labels used to create a trace and plot the bar chart.
- Since the task was to only plot the top 10 values, the three arrays were sliced and reversed to display the chart as below.
- The entire sample arrays were used to plot a bubble chart referring to bacteria cultures per sample.
- The bonus challenge meant to create a gauge chart and was designed using the documentation as a reference. A gauge trace was created with wfreq as the value for plotting:
- Any null values were given a value of zero.
- The gauge chart accounts for weekly washing frequency values ranging from 0-9.
- The default bar indicates the value of wfreq.
- Every time an ID is selected from the dropdown (on change), an optionChanged(this.value) function is called, then the information of the ID is updated.


- Hulcr, J. et al.(2012) A Jungle in There: Bacteria in Belly Buttons are Highly Diverse, but Predictable. 24 July 2021. http://robdunnlab.com/projects/belly-button-biodiversity/results-and-data
- Gauge Chart from: https://plotly.com/javascript/indicator