Quant is a domain-specific language (DSL) for acquiring and visualizing financial time series.
This language was created during the Domain-Specific Languages course at the Faculty of Technical Sciences, University of Novi Sad.
Quant language is used in the financial domain particularly in the stock markets. Stock prices change every day by market forces. The law of supply and demand affects the stock market. If demand for stocks is higher than supply, then the price moves up and vice versa. When supply exceeds demand for stocks, prices fall. In order to gain some profit, it is important to have the right data. This is the time when Quant language comes to the scene. Quant language is used as a tool for financial data science. It collects structured stock market data in form of financial time series. Financial time series represent stock price movements during the time. Quant language also provides financial time series visualization. Acquiring and visualizing financial time series is very important for investment decision-makers because these pieces of information have a huge impact on profitability.
Quant language consists of two sublanguages. The first sublanguage is called Scraper. Scraper is a DSL for acquiring financial time series. Scraper uses Yahoo Finance API to get historical stock market data. After the stock market data has been successfully collected, this data is preserved in the PostgreSQL database. The second sublanguage is called Reporter. Reporter is a DSL for visualizing financial time series. Reporter uses stored financial data to generate financial reports. These reports are generated using Jinja2 templates. Each section in the report represents one Jinja2 template. Reports are saved in HTML and PDF format. Financial reports should provide valuable pieces of information for investors during decision-making.

Contains language description. We get meta-model from language description. Language descriptions are used to derive meta-models.
Contains models. Meta-models are used to instantiate models.
Contains Jinja2 templates. Generated report has multiple parts. Every single part in the report represents one Jinja2 template. There are several different types of Jinja2 templates:
-
General Jinja2 template for general elements in the report.
-
Graphical Jinja2 template for graphs in the report.
-
Pictorial Jinja2 template for images in the report.
-
Tabular Jinja2 template for tables in the report.
-
Textual Jinja2 template for text in the report.
Contains generated financial reports in HTML and PDF format.
Contains models and meta-models visualizations.
scraper YahooFinance {
    ticker: AAPL
    interval: 1d
    start: 2020.12.01
    end: 2020.12.31
}
report YahooFinance {

    general general1 {
        topic: "General stock market report details"
        creator: "Dazzle Novak"
        creation_date: true
        source: "https://finance.yahoo.com"
        source_name: "Yahoo Finance"
        logo_source: "https://www.apple.com"
        logo: "https://res.cloudinary.com/djxkexzcr/image/upload/v1618645330/DSL/logo_dfymyw.png"
        logo_name: "Apple Inc. (AAPL)"

    }

    tabular table1 {
        topic: "Tabular stock market report details"
        source: "https://finance.yahoo.com"
        source_name: "Yahoo Finance"
        border: true

    }

    graphical graph1 {
        topic: "Graphical stock market report details"
        source: "https://finance.yahoo.com"
        source_name: "Yahoo Finance"
        // Generate time series using Date column and one of the following columns: Open, High, Low, Close, Adj Close, or Volume.
        time_series: "Adj Close"
        currency: "USD"

    }

    pictorial picture1 {
        topic: "Pictorial stock market report details"
        source: "https://www.investopedia.com"
        source_name: "Investopedia"
        picture: "https://res.cloudinary.com/djxkexzcr/image/upload/v1618470548/DSL/bull-and-bear-market_fvac5n.jpg"
        width: 850
        height: 600
        // Align picture with one of the following options: center, left, right
        align: "center"
    }

    textual text1 {
        topic: "Textual stock market report details"
        source: "https://www.investopedia.com"
        source_name: "Investopedia"
        text: " Apple Inc (AAPL) closed Wednesday, Jan. 6, at $126.60, down 4.6% so far in 2021.
                The stock set its all-time intraday high of $138.79 on Dec. 29 and is down 8.8% from this high.
                Apple is also in a bull market over the past 52 weeks. It's up 138.2% from its March 23, 2020, low of $53.15.
                The stock has been trading back and forth around its quarterly pivot at $129.97 for each day of January so far.
                The closes on Dec. 31, 2020, were inputs to my proprietary analytics and resulted in new monthly, quarterly,
                semiannual, and annual levels. Each uses the last nine closes in these time horizons.
                New weekly levels are calculated after the end of each week. New monthly levels occur after the close of each month.
                New quarterly levels occur at the end of each quarter. Semiannual levels are updated at mid-year.
                Annual levels are in play all year long.
                My theory is that nine years of volatility between closes are enough to assume that all possible bullish or bearish
                events for the stock are factored in. To capture share price volatility, investors should buy shares on weakness to
                a value level and reduce holdings on strength to a risky level. A pivot is a value level or risky level that was
                violated within its time horizon. Pivots act as magnets that have a high probability of being tested again before their
                time horizon expires."
        // The name of a font-family, like "times", "courier", "arial", "verdana", etc.
        font: "verdana"
        size: 100
        color: "red"
        // Align text with one of the following options: center, left, right, justify
        align: "justify"
    }

}


- Python 3.7+
- textX
- Graphviz
- wkhtmltopdf
- Jinja2 template engine
- PostgreSQL
- SQLAlchemy
- pgAdmin
- Chart.js
Install instructions:
Install Python 3.7+
Install Graphviz
Install wkhtmltopdf
Install PostgreSQL
Install pgAdmin
pgAdmin and PostgreSQL database instructions:
Open pgAdmin, create PostgreSQL database, and remember database credentials:
db_name
db_user
db_password
Python environment instructions:
$ git clone https://github.com/DusanStevic/textx-lang-quant.git
$ python -m venv env
$ source env/bin/activate
$ pip install -r requirements.txt
Quant language instructions:
$ pip install -e textx-lang-quant
Check models and meta-models for syntax and semantic validity instructions:
$ textx check scraper.tx
$ textx check query.scrp --grammar scraper.tx
$ textx check report.tx
$ textx check report.rprt --grammar report.tx
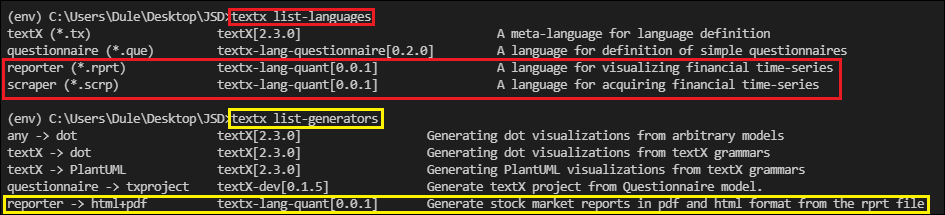
List registered languages and generators instructions:
$ textx list-languages
$ textx list-generators
Scrape stock market data from Yahoo Finance API. Save scraped data to PostgreSQL database:
$ python interpreter.py path/to/*.scrp db_name db_user db_password
Call registered generators and transform given models to other target languages. Generate your stock market report:
$ textx generate --target html+pdf path/to/*.rprt
Visualize models and meta-models by generating visualizations:
$ python visualizator.py path/to/*.scrp
$ python visualizator.py path/to/*.rprt
This project is licensed under the terms of the MIT license.