This code generates split time distribution, traces and heatmaps plots for "Mario Kart 8 Deluxe" speedruns saved with LiveSplit (.lss format). It was coded as a side-project/hobby to analyze the progress and focus practice in my clumsy attempts at getting into speedrunning. Whilst the code works and is flexible, it does require a bit of know-how in Python to make slight changes if customization is desired.
For more details about the plots and information, have a look at my blogpost.
To run the script, install the required dependencies and call the following command from the terminal:
python main.py dataFile outputDirectory videoOffsetwhere:
- dataFile is the path to the lss file (exported to disk from LiveSplit or equivalent)
- outputDirectory is path where the output files should be exported
- videoOffset is the offset to the beginning of the run (set to 0 if timestamps are not needed)
An example on how to call the script would be:
python main.py\
    './dta/Mario Kart 8 Deluxe - 48 Tracks (200cc, Digital, No Items).lss'\
    ./img/\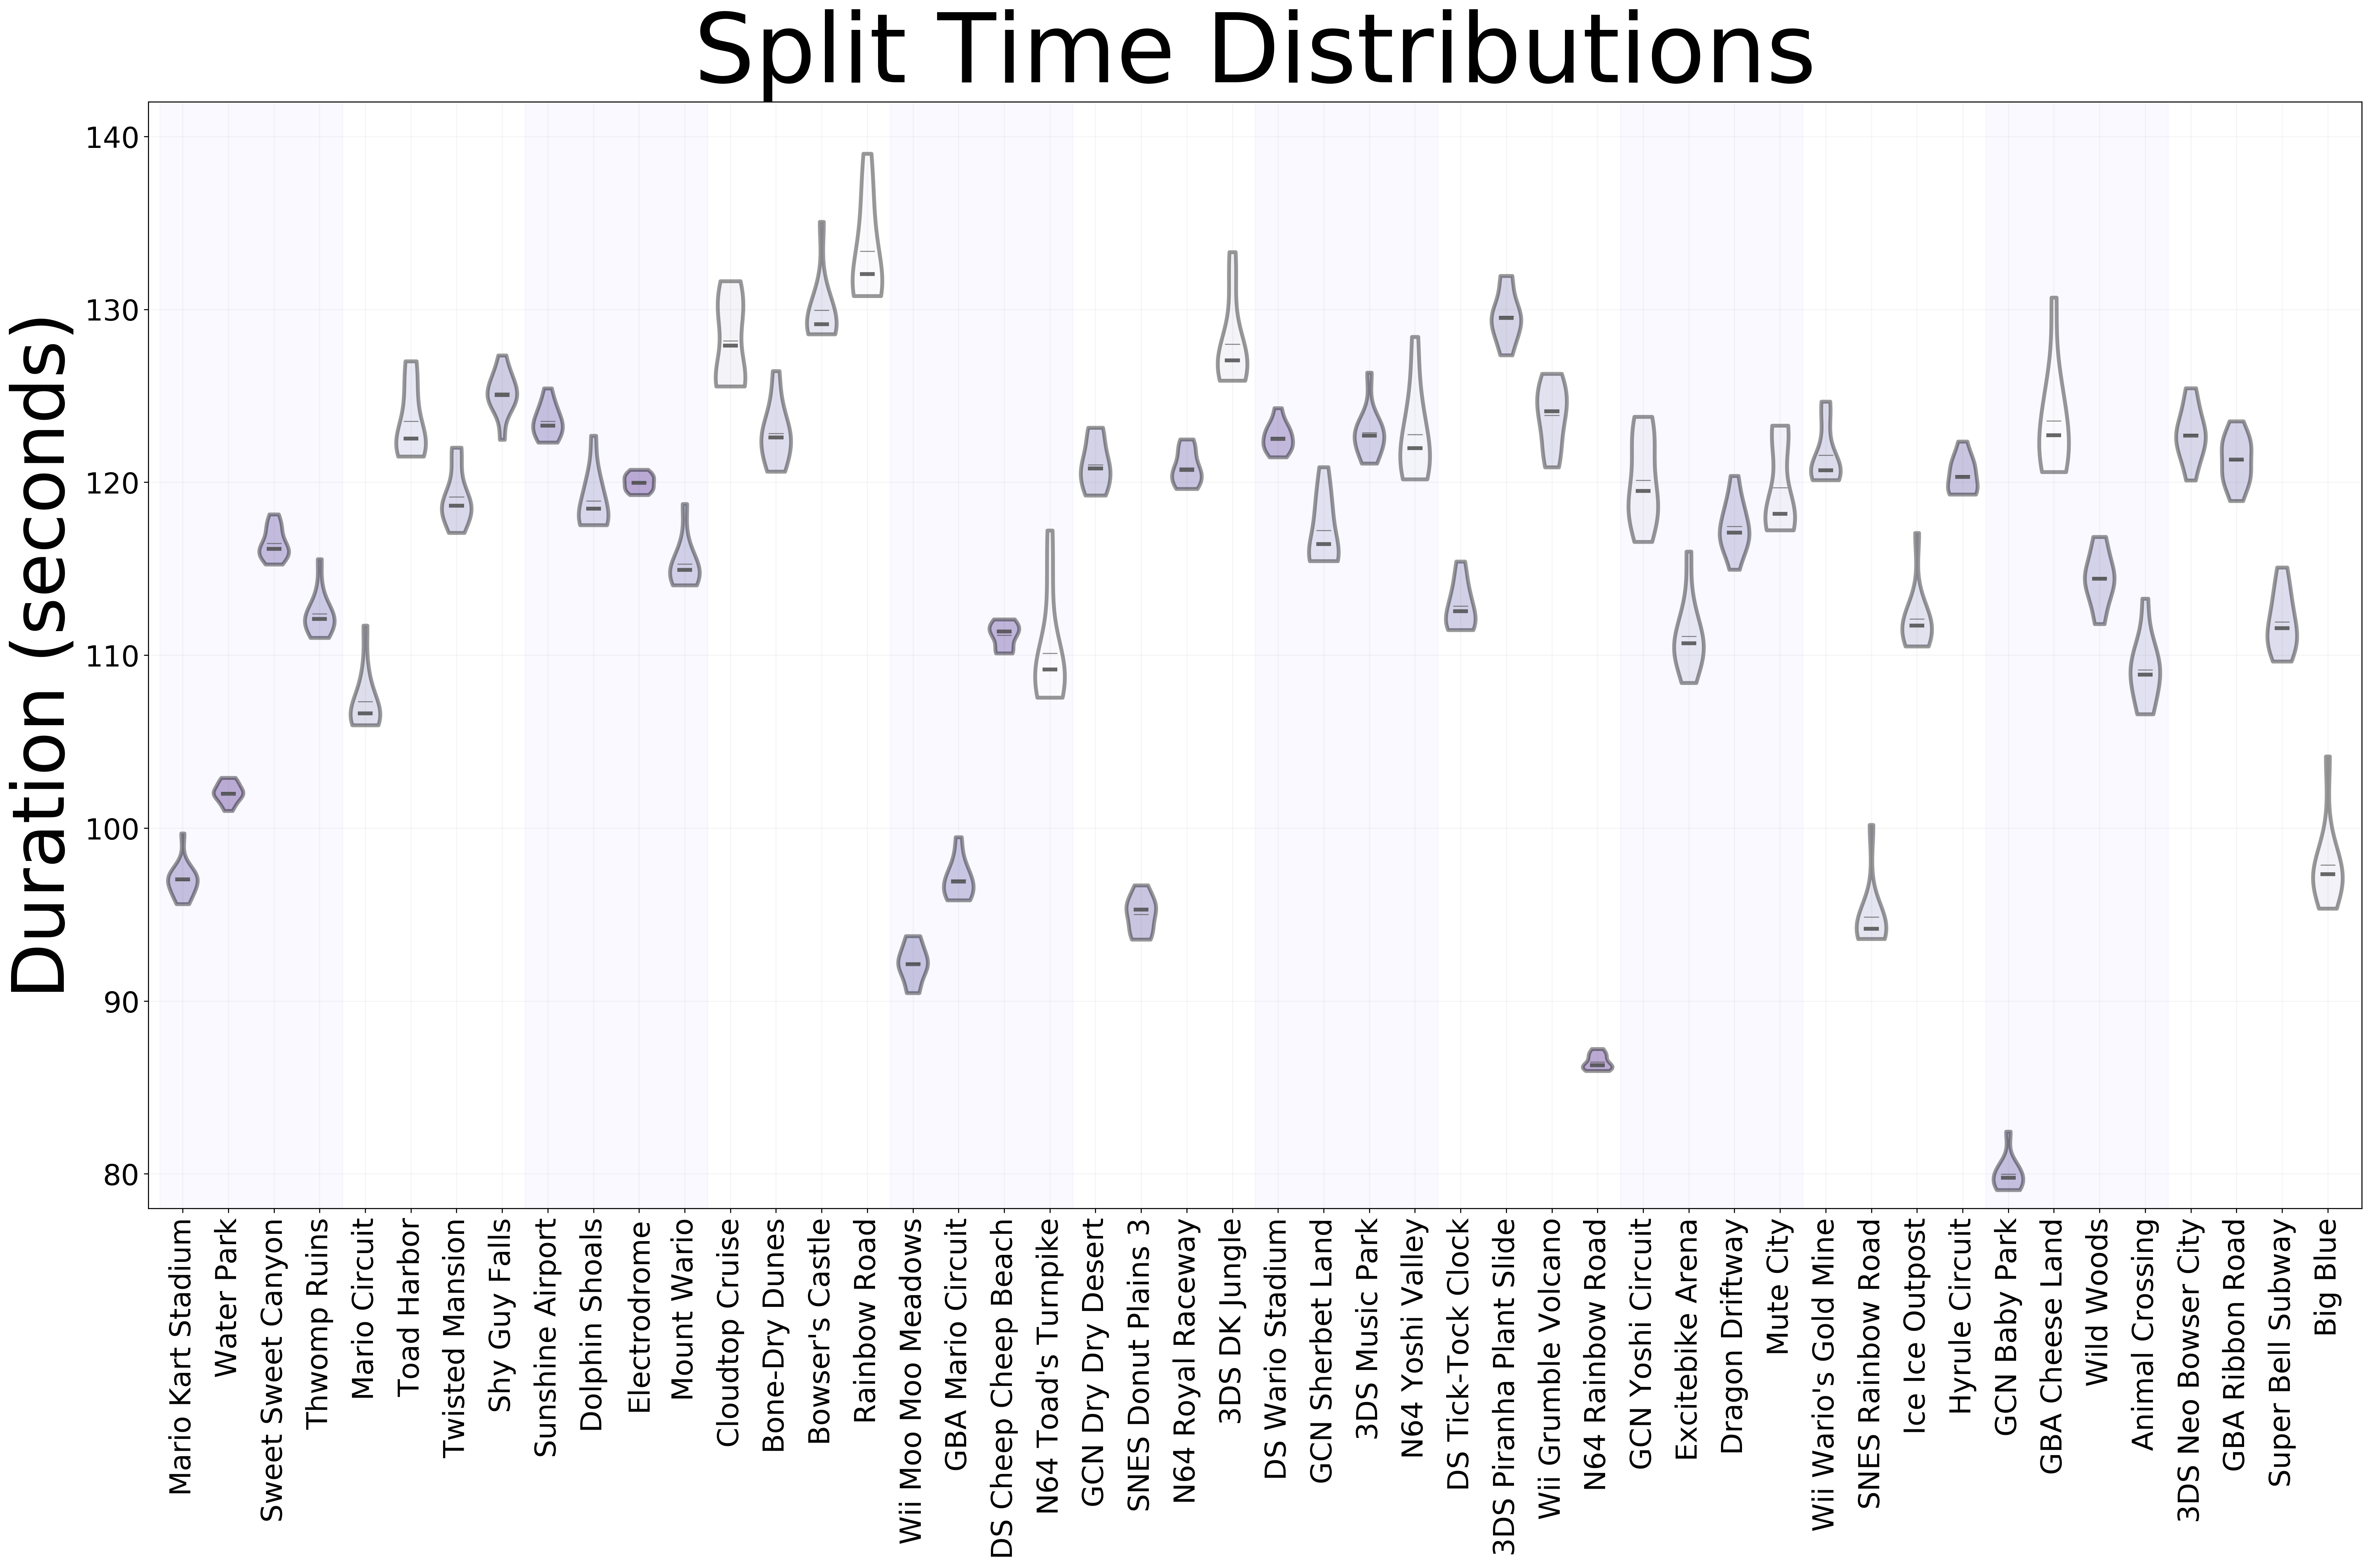
32\This plot shows the distributions of each one of the splits. Median is highlighted in a thick rectangle, whilst the mean is shown in a thin line. Splits with widest spread have more variation (meaning they need more practice).
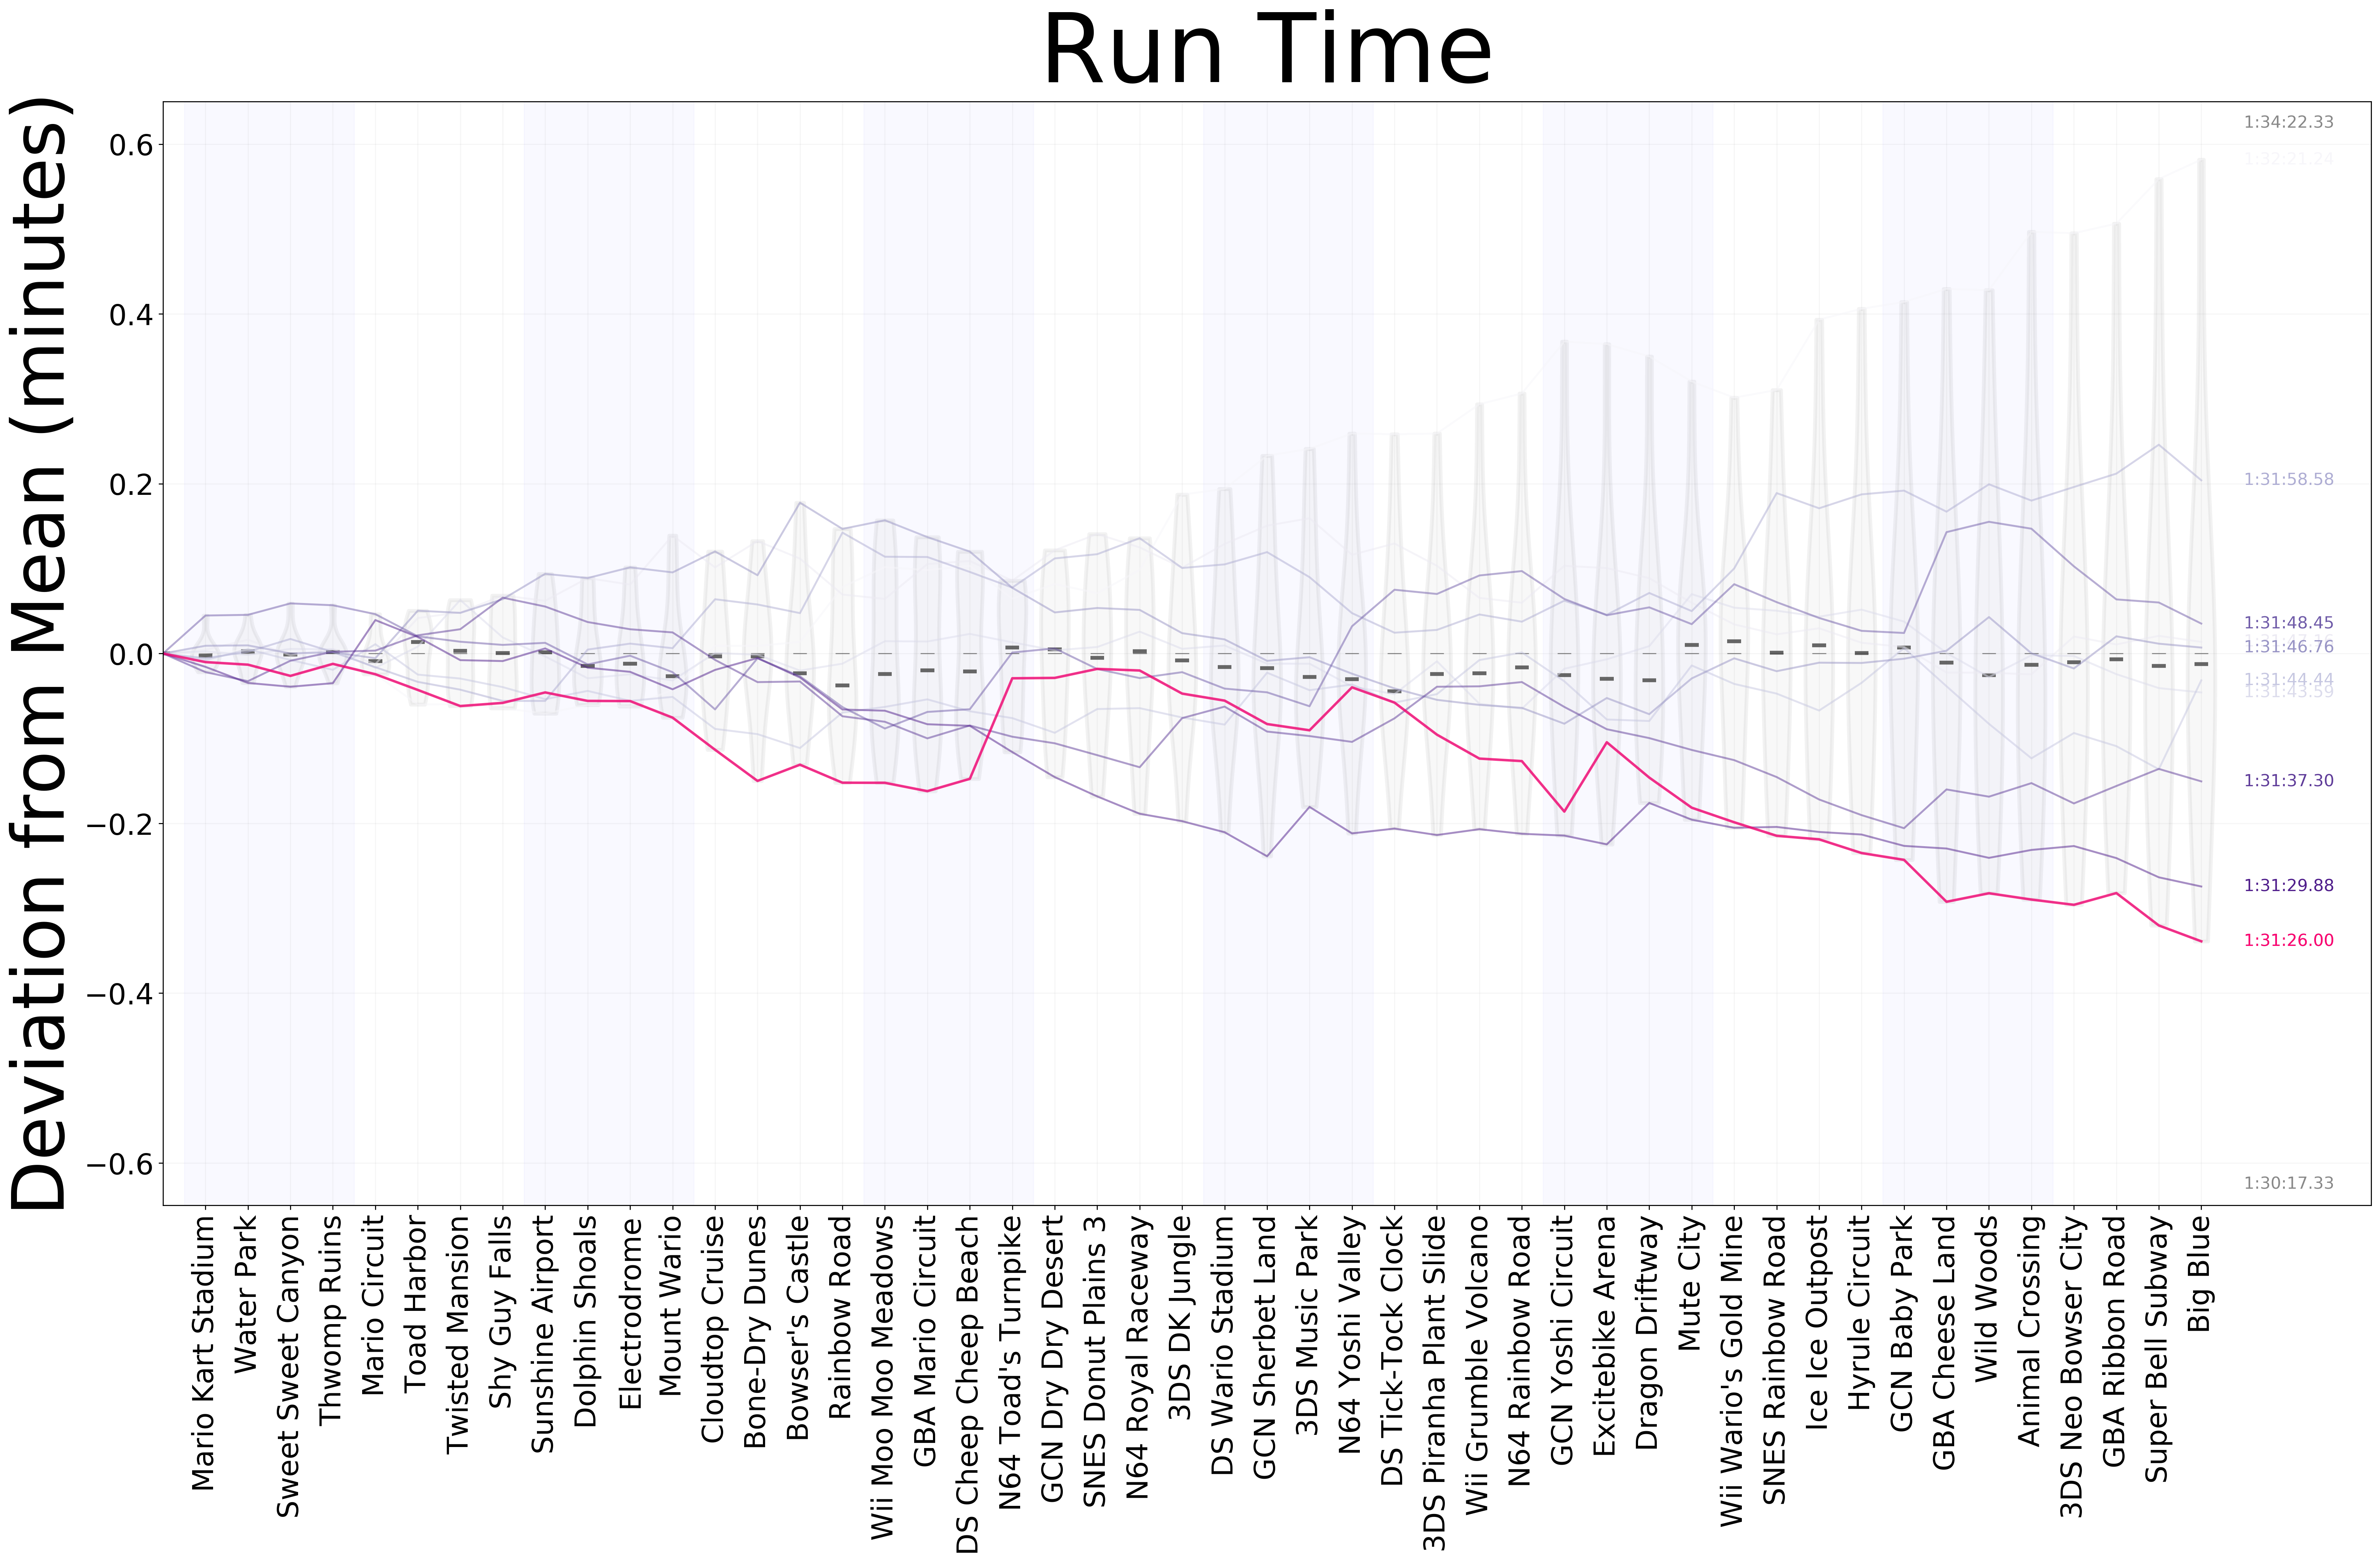
Shows the cumulative times of the finished splits in one plot. Darker lines are more recent runs (using the standard cmap palette provided), and the plot is centered around the mean, showing the deviation from the average time at that point in the run. Median is highlighted in each violin, and the final runtime is also shown (with the sum of best segments shown at the bottom, and sum of worst at the top). Personal best is highlighted in magenta by default.
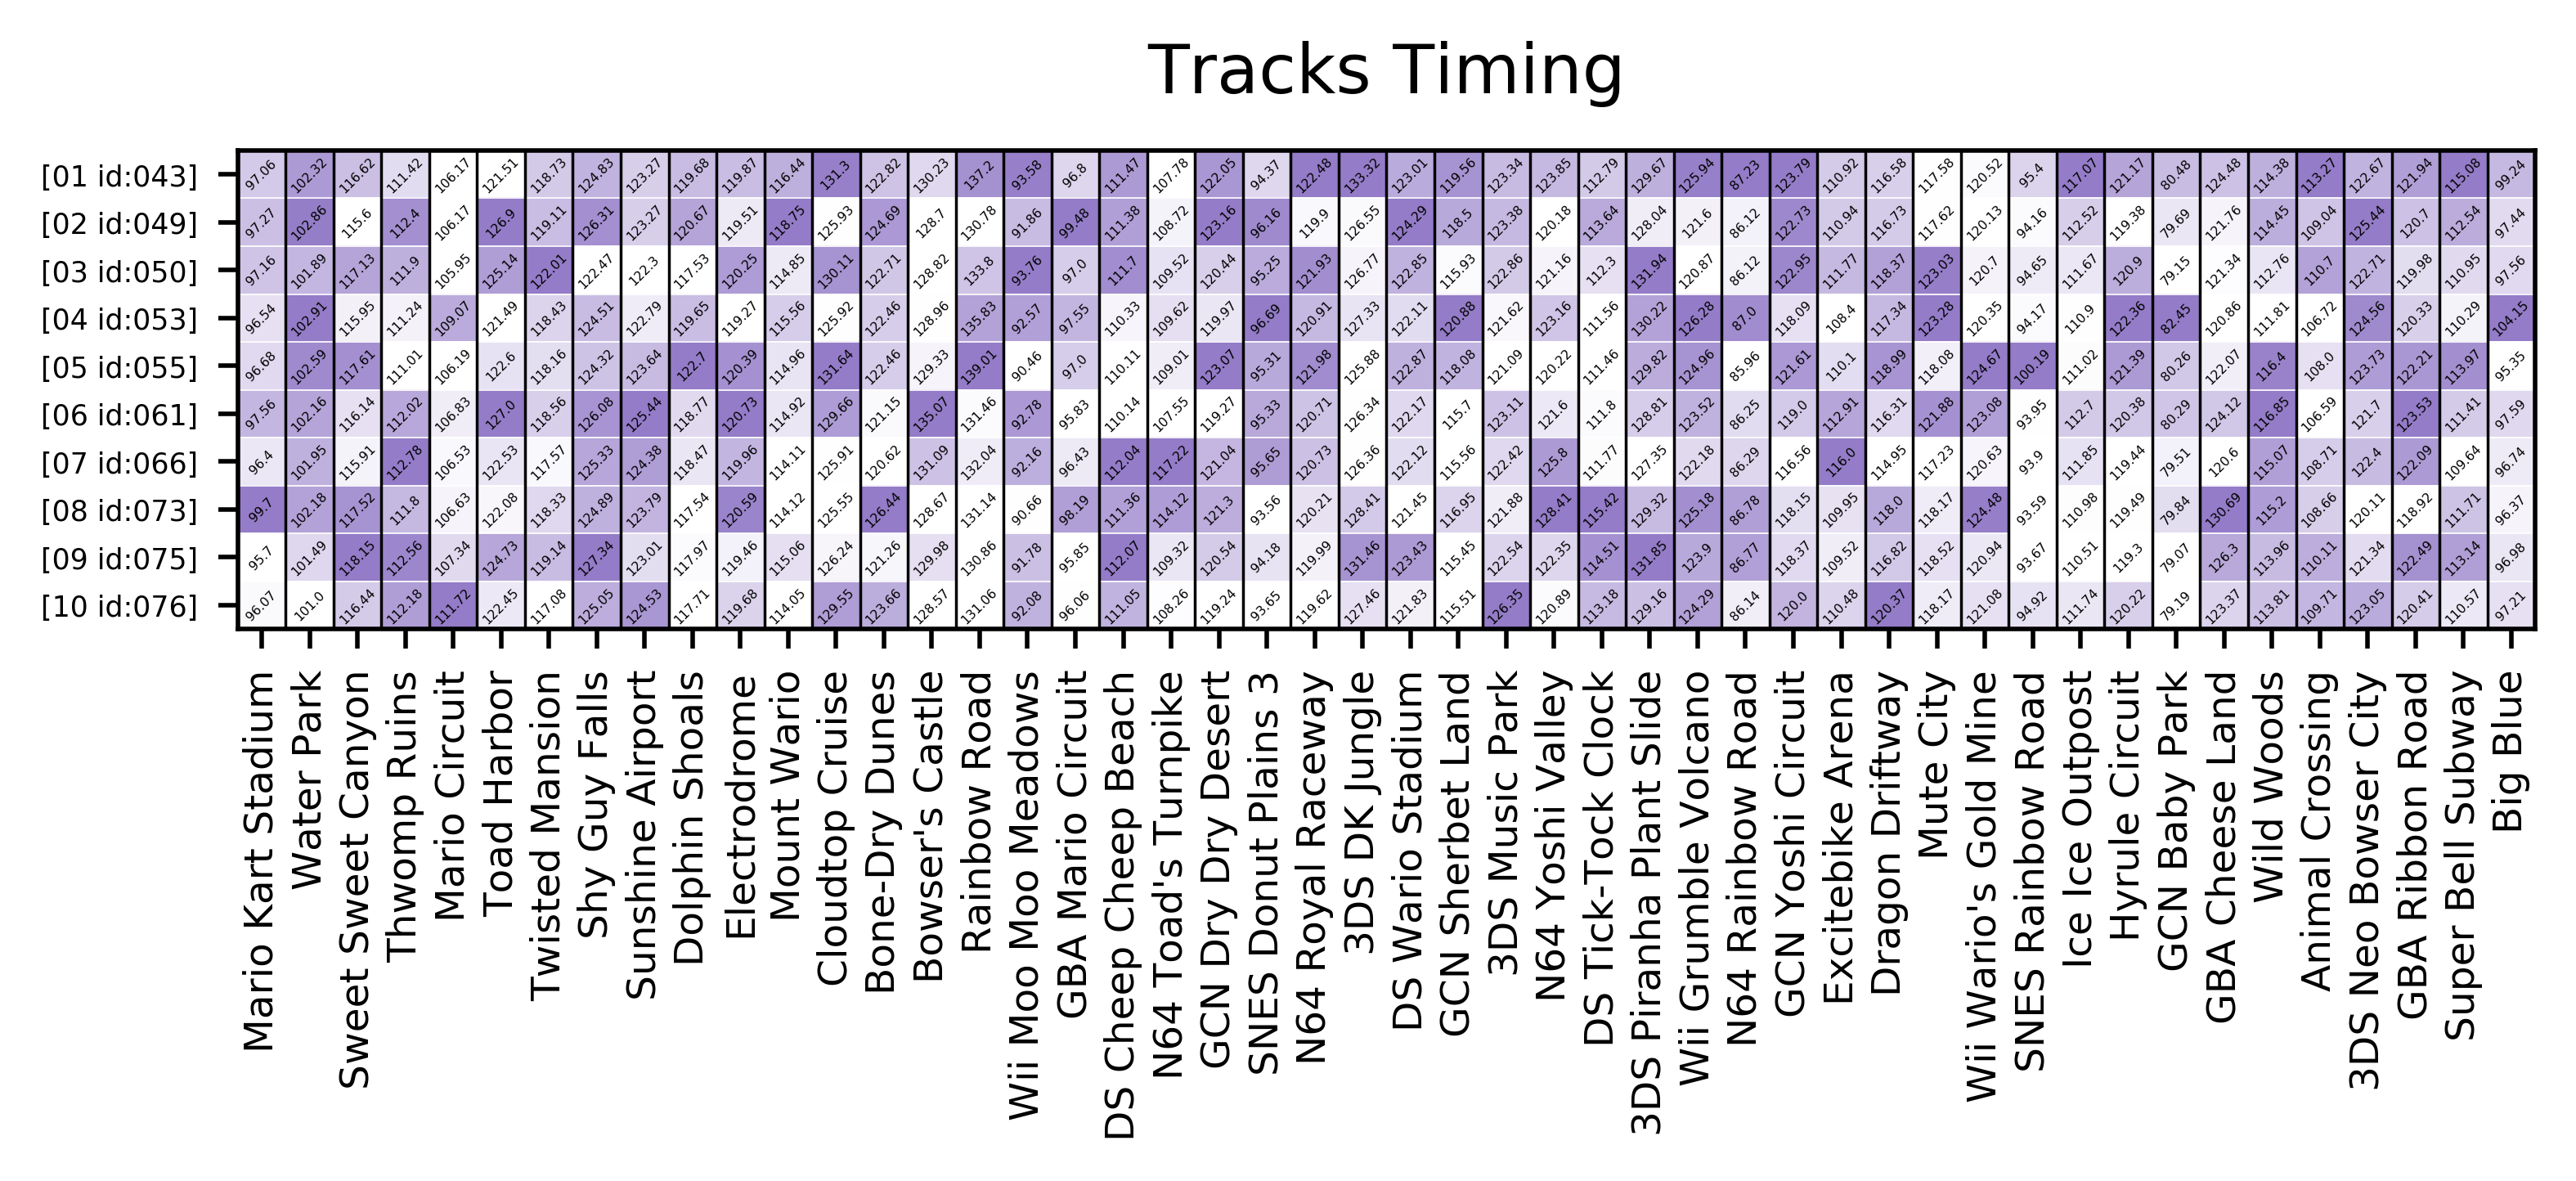
This heatmap shows the timing for each track (column) split per run (rows). The color of the cell is mapped to its difference to the best split (white is the best split in the standard palette provided, whilst blue is the worst).
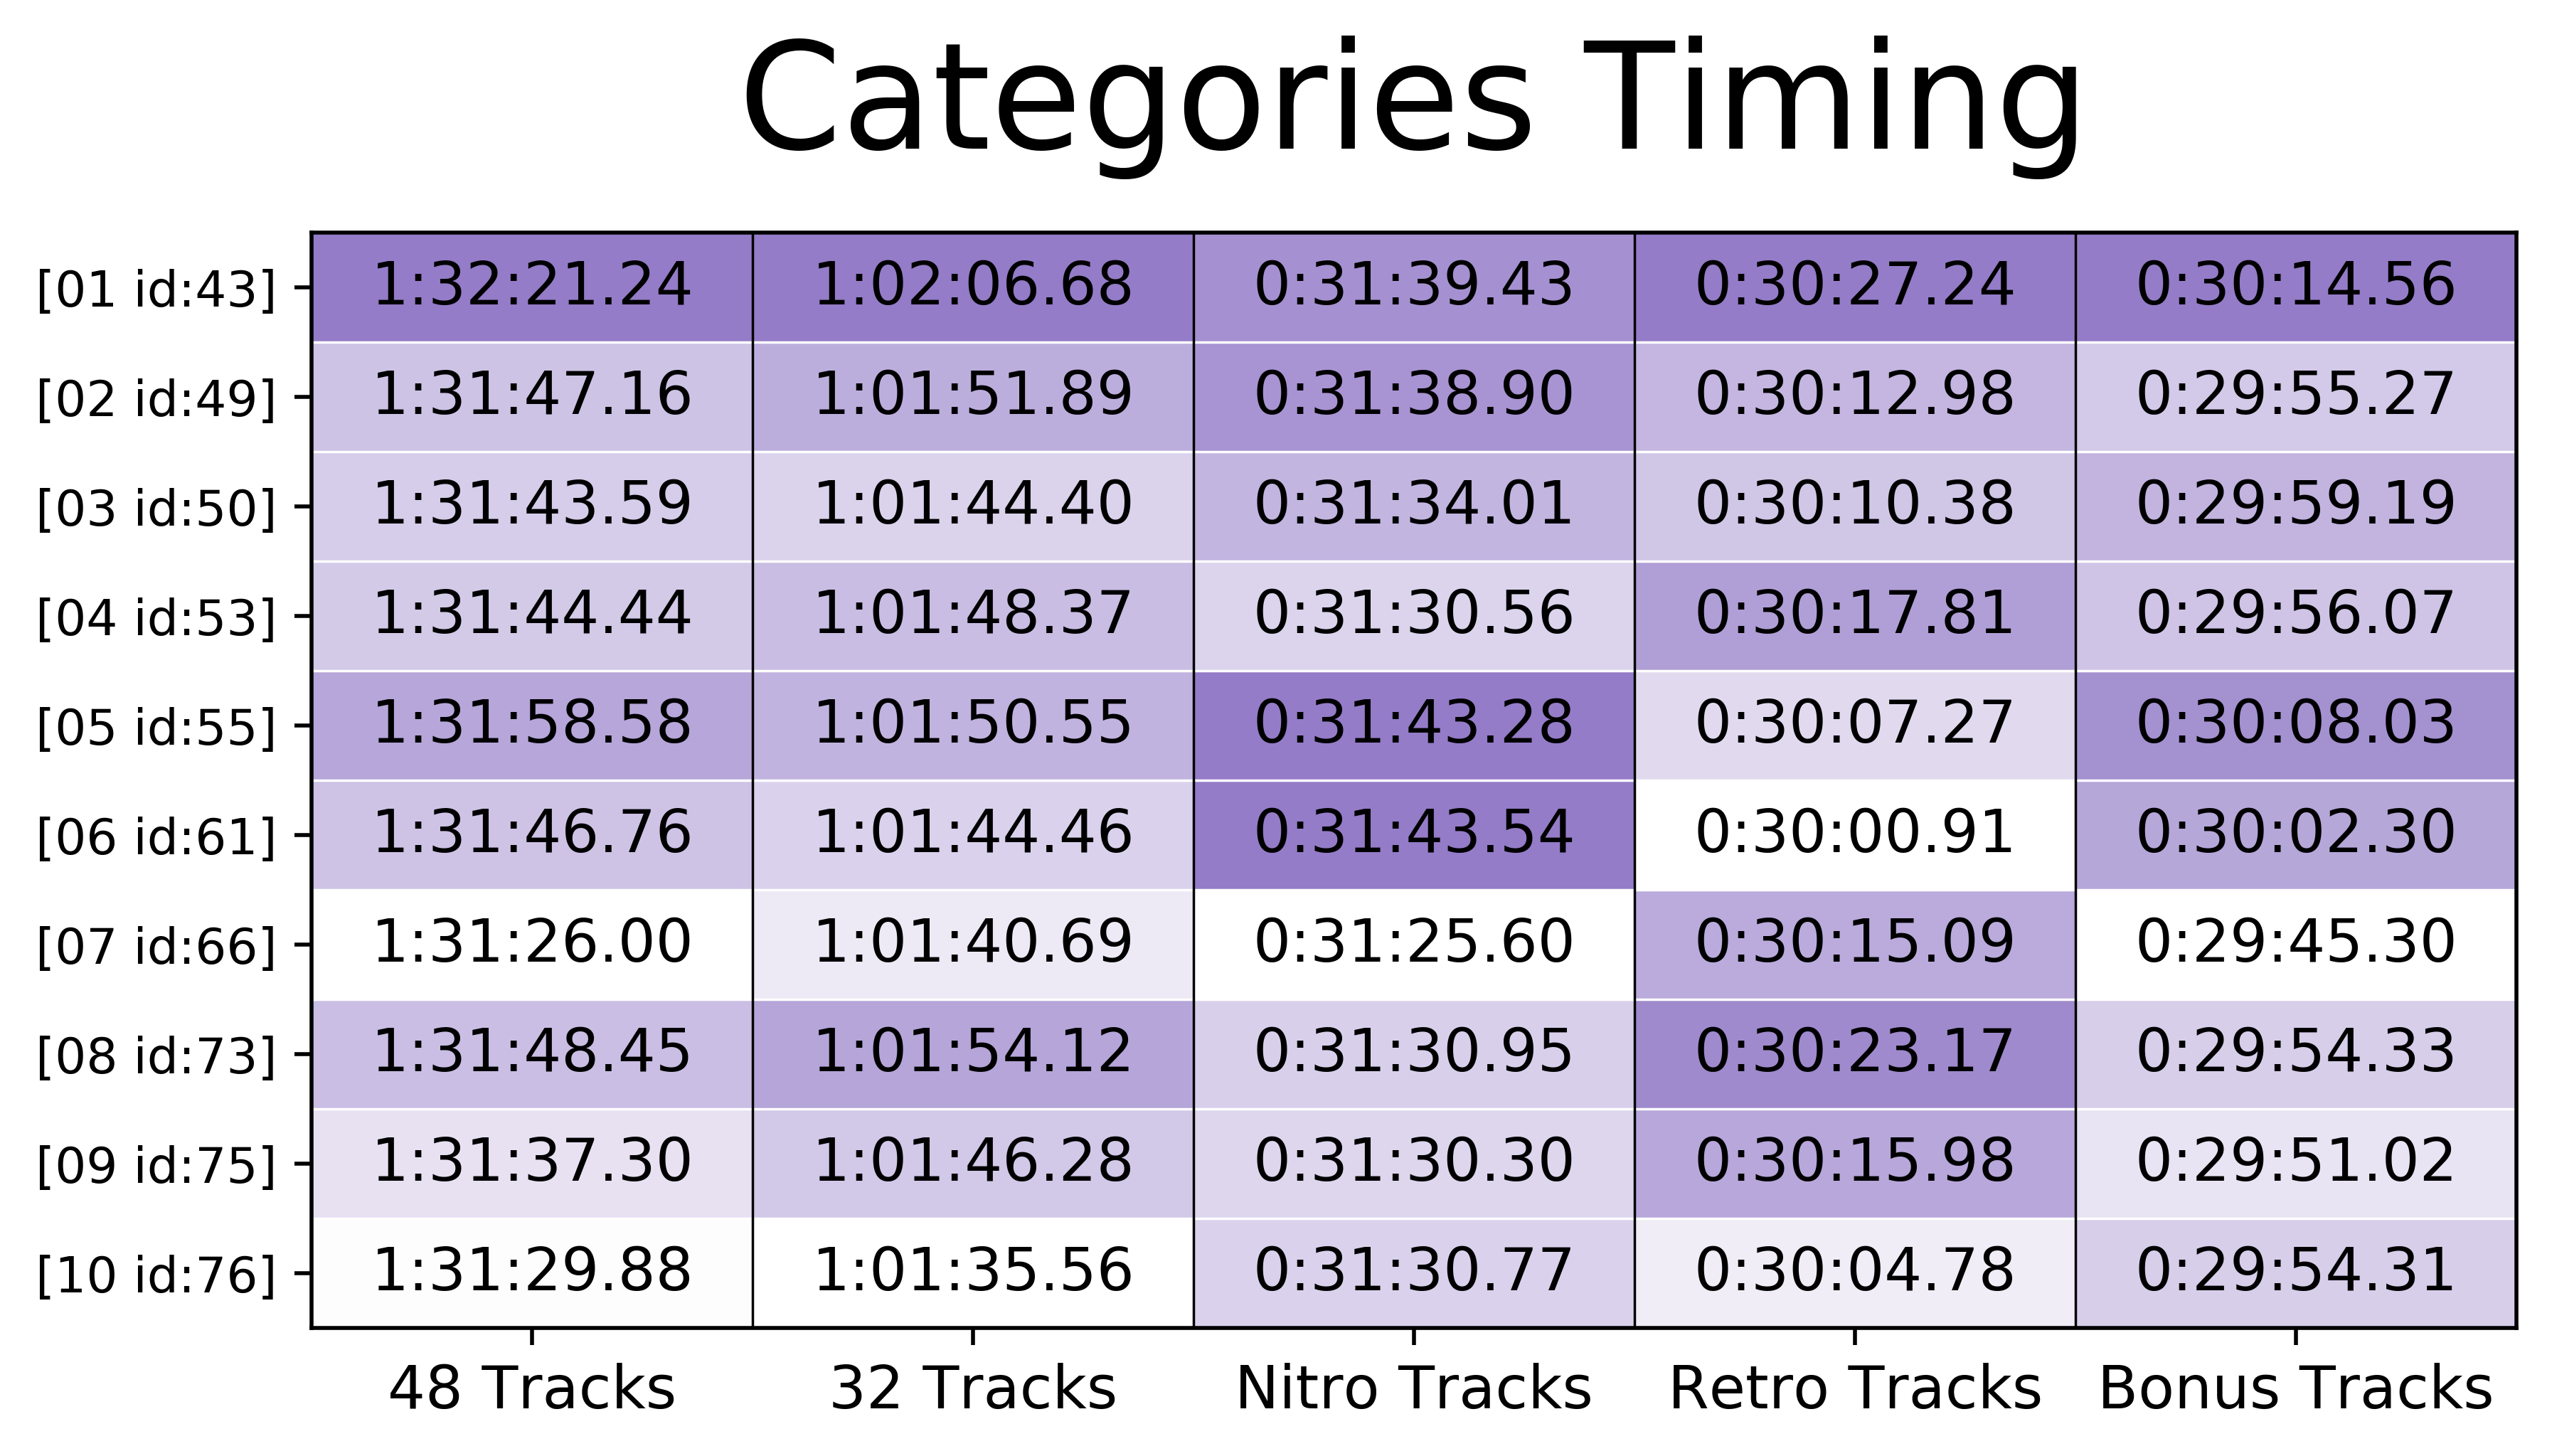
Same as with splits heatmap, but this one calculates the information for the current categories on the speedrun.com leaderboards.
Warning: This routine assumes it's a 48 track run, and backtracks the categories from a "finished run". Non-48 track runs are omitted (this needs fixing in future versions).
Given a video start offset (the point where the first track, "Mario Kart Stadium" begins), it calculates and exports the timestamps for all the other tracks to a txt file so that it can be used in Youtube videos.
Mario Kart Stadium: 0:30:00
Water Park: 0:02:06
Sweet Sweet Canyon: 0:03:47
Thwomp Ruins: 0:05:43
Mario Circuit: 0:07:35
...
Animal Crossing: 1:22:38
3DS Neo Bowser City: 1:24:28
GBA Ribbon Road: 1:26:31
Super Bell Subway: 1:28:32
Big Blue: 1:30:22
This one's just a helper function mostly developed for myself as it exports the title, timings, tags and other things I post in my MK8D youtube videos.
[10] MK8D 1:31:29.88 (200cc, 48 tracks, no items, digital)
48 Tracks - 1:31:29.88
32 Tracks - 1:01:35.56
Nitro Tracks - 0:31:30.77
Retro Tracks - 0:30:04.78
Bonus Tracks - 0:29:54.31
https://www.speedrun.com/user/chipdelmal
mk8d, mario kart, speedrun, speed run, gaming, 48, 200cc, no item, switch
The required dependencies are numpy, matplotlib and xmltodict. To install them, run:
pip install numpy
pip install matplotlib
pip install xmltodictUnfortunately, I don't have enough time to document the code (this being a hobby and having a lot of work lately), but I will explain briefly the standards followed in case anyone is interested in using or extending it.
Most of the functionality revolves around using OrderedDict objects to re-shape and transform the information. The general structure is:
dictionary
    * Segment Name 1
        * Run Id 1: segment time
        * Run Id 2: segment time
        ...
        * Run Id N: segment time
    * Segment Name 2
        * Run Id 1: segment time
        * Run Id 2: segment time
        ...
        * Run Id N: segment time
    ...
    * Segment Name Z
        * Run Id 1: segment time
        * Run Id 2: segment time
        ...
        * Run Id N: segment time
For the runsHistory object, each segment contains all of the runs and the segment time in that split. The fshdRunHistoryCml, in contrast, contains all the finished runs (full runs) times and stores the cumulative time of the run.
The runsStats and fshdRunsStatsCml objects have the following structure:
dictionary
    * Segment Name 1
        * 'Min': Best time
        * 'Max': Worst time
        * 'Mean': Mean
        * 'Median': Median
        * 'SD': Standing variation
        * 'Variance': Variance
    ...
    * Segment Name Z
        * 'Min': Best time
        * 'Max': Worst time
        * 'Mean': Mean
        * 'Median': Median
        * 'SD': Standing variation
        * 'Variance': Variance
and they follow the same principles as the ones described before. All of the provided functions should work for other types of runs as long as they follow these standards.
Additionally, the code-base provides functions to get the information of individual runs from their ID.
As mentioned before, this code is provided "as is" in hopes that it is useful to the community. I'll try to fix some of the bugs and extend it if I have more time. I know the style can be greatly improved, and hopefully I'll get some of these extensions out in the future.
This is probably the most pressing issue. The cumulative times (traces plot) only shows the finished runs, which means that truncated attempts are filtered out. This can be fixed by not filtering the runs with the finished ids and padding their missing track times with None so that they maintain the same shape (length) as finished ones.
Categories times calculations currently depend on tracks being named according to the following standard:
'Mario Kart Stadium', 'Water Park', 'Sweet Sweet Canyon', 'Thwomp Ruins',
'Mario Circuit', 'Toad Harbor', 'Twisted Mansion', 'Shy Guy Falls',
'Sunshine Airport', 'Dolphin Shoals', 'Electrodrome', 'Mount Wario',
'Cloudtop Cruise', 'Bone-Dry Dunes', "Bowser's Castle", 'Rainbow Road',
'Wii Moo Moo Meadows', 'GBA Mario Circuit', 'DS Cheep Cheep Beach', "N64 Toad's Turnpike",
'GCN Dry Dry Desert', 'SNES Donut Plains 3', 'N64 Royal Raceway', '3DS DK Jungle',
'DS Wario Stadium', 'GCN Sherbet Land', '3DS Music Park', 'N64 Yoshi Valley',
'DS Tick-Tock Clock', '3DS Piranha Plant Slide', 'Wii Grumble Volcano', 'N64 Rainbow Road',
'GCN Yoshi Circuit', 'Excitebike Arena', 'Dragon Driftway', 'Mute City',
"Wii Wario's Gold Mine", 'SNES Rainbow Road', 'Ice Ice Outpost', 'Hyrule Circuit',
'GCN Baby Park', 'GBA Cheese Land', 'Wild Woods', 'Animal Crossing',
'3DS Neo Bowser City', 'GBA Ribbon Road', 'Super Bell Subway', 'Big Blue'
This can be fixed by passing an argument to the category-related function (as opposed to current's hard-coded names); or, better yet, by getting names of the tracks by position in the run (instead of doing it directly by name).
Violin and Traces plots currently have a bug in which passing a custom color palette with alpha values clashes with the additional alpha setting. This can be fixed by doing optional arguments in a standard way or adding clauses for exceptions.
Right now the terminal call is extremely strict, but adding additional arguments shouldn't be too much of a hassle.
For more information, read my blogpost.