In this Spring Boot application I have implemented Connection Pool to make the data base connection more robust and faster. To implement Connection Pool I have used HikariCP. With Connection Pool I have also implemented
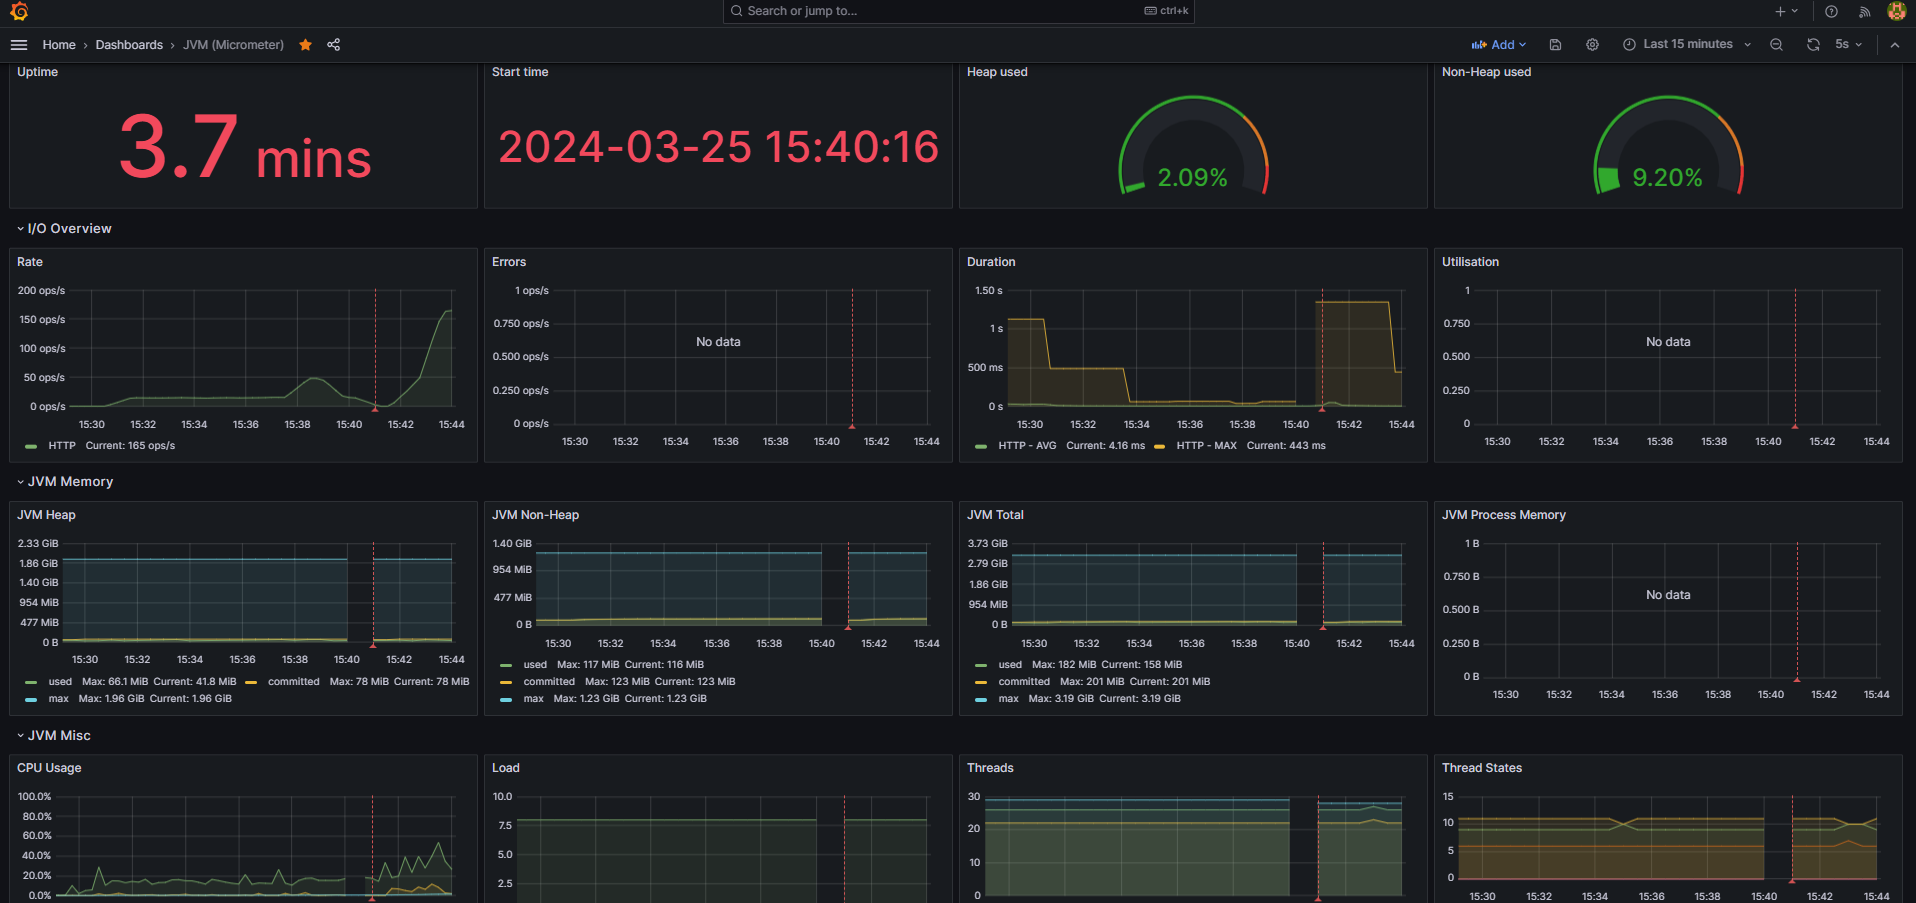
2.Grafana (Grafana is an analytics and visualization web application that can ingest data from various sources and display it in customizable charts).
With both of these I can monitor the connection pool in real time.
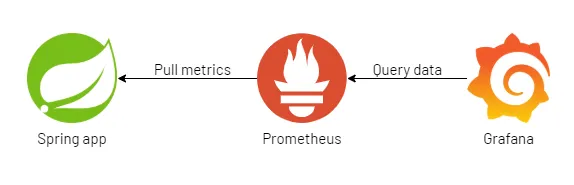
To configure Prometheus I have used the prometheus.yml and to configure grafana for visualizing the metrices I have used the SpringBoot_Hikari_CP_Monitoring_Dashboard.json(for monitoring Hikari CP ) and JVM_Monitoring_Dashboard.json(for monitoring the entire JVM).
- Add the required dependencies for monitoring the metrices like Actuator and many more.
- Configure the dependencies in the application.properties file.
- Run the Spring boot application.
- Then download Prometheus and after that just run it via prometheus.exe
- Then configure the Prometheus data via prometheus.yml.
- Then download Grafana and after installing run it via grafana.exe which is located in the - "C:\Program Files\GrafanaLabs\grafana\bin" path.
- Log in to Grafana by using Username - "admin" and Password - "admin"
- Then add the Grafana dashboard from the given json and add the running prometheus data source as metrics data for Grafana. Note : Grafana runs at "http://localhost:3000/" and Prometheus runs at "http://localhost:9090/".