Welcome to Altruistiq! Thank you very much for taking the time to do this task. 🙏
In this task you'll be creating an application consisting of an API, and a frontend consuming that API and rendering a chart.
The goal is not the create the most complete app, but to understand how you solve problems and how you code. Upon delivering the app, we will discuss your solutions, decisions and thought process.
We suggest to not spent more than 2 hours, but you're free to spend more time. And don't worry if it takes you longer. Also it's fine to descope parts of the task, that's really up to you.
This repo will help you to kick-start your application. A backend has been setup for you, but for the frontend you're free to use anything you like. For Vue we suggest Vite, for React Create-React-App. It's also totally fine to use Next/Nuxt for the whole project and copy over the provided code. Whatever stack works for you!
Clone this repo, then
npm iin .env copy over the secret that you've received from us.
Code automatically reloads upon code changes.
The backend runs on port 5000, go to http://localhost:5000/ to
npm startTo run test the backend needs to be running (code and tests are being watched so automatically reruns).
npm test
Please read through all the tasks to understand the full scope of this assessment.
To get the data for this API, you will use the footprint api which has already been setup for you. Use as follows:
import footprintApi from './footprintApi'

// get all countries and their countryCodes
await footprintApi.getCountries()

// this will give you carbon data per year for that country
await footprintApi.getDataForCountry(countryCode)
The emissions number is represented in the country json as carbon, this is the number you're looking for.
Note: there are (unknown) rate limits on the footprint API which you will need to work around.
Write test(s) to make sure your API works as expected.
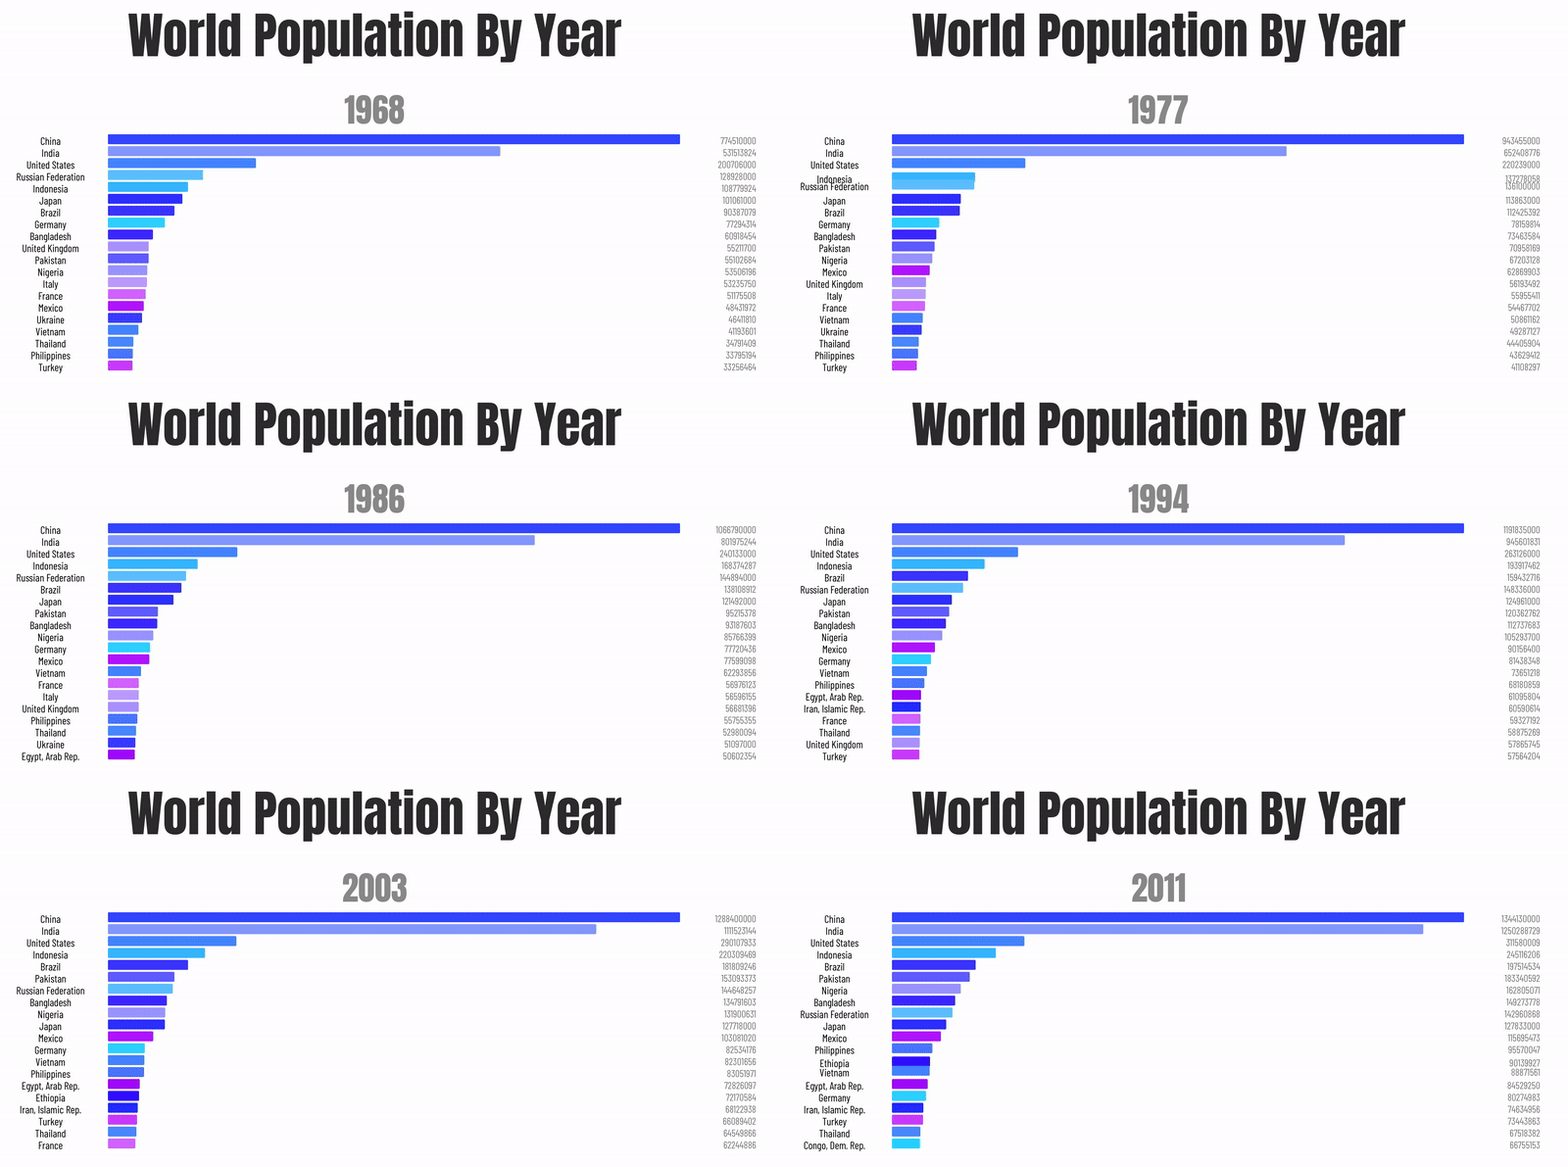
Create a chart as per this example, but style it as per the Figma design. The chart iterates through the available years, and shows for each year a list of countries sorted by the emission for that year. Note that some countries do not have data for a specific year.
Fetch this Figma file to get started.
The font used is
@import url('https://fonts.googleapis.com/css2?family=Inter:wght@300;400;500;600&display=swap')
Requirements:
- use Vue or React, and Sass
- use either components, native DOM or D3 to create the chart.
- do not use chart / css / component / animation / caching libraries. The idea is that you show your skills by coding this manually.
- chart should be responsive, test by changing the window size (dragging)
- calculate and show world total footprint on the page
Please provide a git repository with your code and send us the url.
