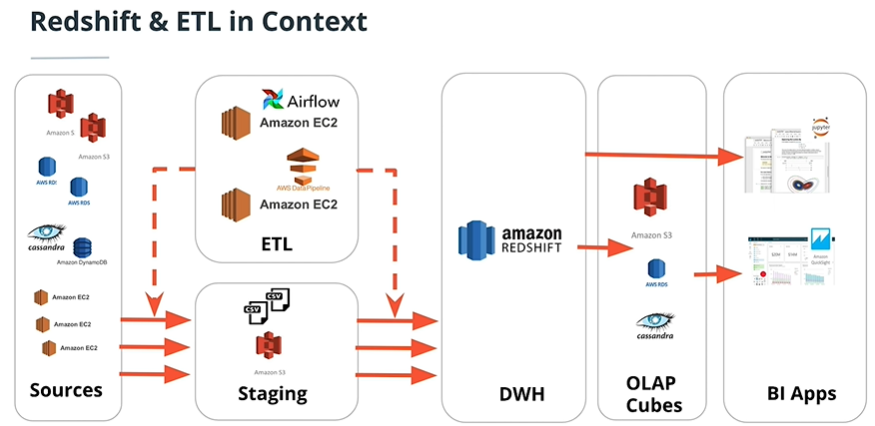
A music streaming startup, Sparkify, has grown their user base and song database and want to move their processes and data onto the cloud. Their data resides in S3, in a directory of JSON logs on user activity on the app, as well as a directory with JSON metadata on the songs in their app. Building ETL pipeline that extracts data from S3, stages them in Redshift, and transform data into a set of dimensional tables for their analytics team.
create_table.pyis where you'll create your fact and dimension tables for the star schema in Redshift.etl.pyis where you'll load data from S3 into staging tables on Redshift and then process that data into your analytics tables on Redshift.sql_queries.pyis where you'll define you SQL statements, which will be imported into the two other files above.README.mdis where you'll provide discussion on your process and decisions for this ETL pipeline.
Their are two datasets that resides in S3. Here are the S3 links for each:
- Song data:
s3://udacity-dend/song_data - Log data:
s3://udacity-dend/log_data
Log data json path:
s3://udacity-dend/log_json_path.json
The first dataset is a subset of real data from the Million Song Dataset. Each file is in JSON format and contains metadata about a song and the artist of that song. The files are partitioned by the first three letters of each song's track ID. For example, here are file paths to two files in this dataset.
song_data/A/B/C/TRABCEI128F424C983.json
song_data/A/A/B/TRAABJL12903CDCF1A.json
And below is an example of what a single song file, TRAABJL12903CDCF1A.json, looks like.
{"num_songs": 1, "artist_id": "ARJIE2Y1187B994AB7", "artist_latitude": null, "artist_longitude": null, "artist_location": "", "artist_name": "Line Renaud", "song_id": "SOUPIRU12A6D4FA1E1", "title": "Der Kleine Dompfaff", "duration": 152.92036, "year": 0}
The second dataset consists of log files in JSON format generated by this event simulator based on the songs in the dataset above. These simulate app activity logs from an imaginary music streaming app based on configuration settings.
The log files in the dataset you'll be working with are partitioned by year and month. For example, here are file paths to two files in this dataset.
log_data/2018/11/2018-11-12-events.json
log_data/2018/11/2018-11-13-events.json
And below is an example of what the data in a log file, 2018-11-12-events.json, looks like.

- Design schemas for your fact and dimension tables
- Write a SQL
CREATEstatement for each of these tables insql_queries.py - Complete the logic in
create_tables.pyto connect to the database and create these tables - Write SQL
DROPstatements to drop tables in the beginning ofcreate_tables.pyif the tables already exist. This way, you can runcreate_tables.pywhenever you want to reset your database and test your ETL pipeline. - Launch a redshift cluster and create an IAM role that has read access to S3.
- Add redshift database and IAM role info to
dwh.cfg.
[CLUSTER]
HOST=redshift-cluster-1.************.us-east-1.redshift.amazonaws.com
DB_NAME=dev
DB_USER=awsuser
DB_PASSWORD=**********
DB_PORT=5439

[IAM_ROLE]
ARN= arn:aws:iam::************:role/dwhRole

[S3]
LOG_DATA='s3://udacity-dend/log_data'
LOG_JSONPATH='s3://udacity-dend/log_json_path.json'
SONG_DATA='s3://udacity-dend/song_data'
- Test by running
create_tables.pyand checking the table schemas in your redshift database. You can use Query Editor in the AWS Redshift console for this.
- Implement the logic in
etl.pyto load data from S3 to staging tables on Redshift. - Implement the logic in
etl.pyto load data from staging tables to analytics tables on Redshift. - Test by running
etl.pyafter runningcreate_tables.pyand running the analytic queries on your Redshift database to compare your results with the expected results. - Delete your redshift cluster when finished.
staging_songs
| COLUMN | TYPE |
|---|---|
| num_song | int |
| artist_id | varchar |
| artist_latitude | decimal |
| artist_longitude | decimal |
| artist_name | varchar |
| song_id | varchar |
| title | varchar |
| duration | decimal |
| year | int |
staging_events
| COLUMN | TYPE |
|---|---|
| artist | varchar |
| auth | varchar |
| firstName | varchar |
| gender | varchar |
| itemInSession | int |
| lastName | varchar |
| length | decimal |
| level | varchar |
| location | varchar |
| method | varchar |
| page | varchar |
| registeration | varchar |
| sessionId | int |
| song | varchar |
| status | int |
| ts | timestamp |
| userAgent | varchar |
| userId | int |
Fact table songplay
Dimension Tables users songs artists time