Calico provides methods to enable fine-grained access controls between microservices and external databases, cloud services, APIs, and other applications.
In this module, we will learn how to use Calico to create network policies to control access to and from a pod. We will install the Example Voting Application. Once the application is deployed, we will create and test network security policies with different ingress and egress rules to demonstrate how workload access control is done.
-
Clone this repository in your Azure Cloud Shell.
git clone https://github.com/tigera-solutions/cc-aks-visualize-identify-security-gaps.git && \
cd cc-aks-visualize-identify-security-gaps
-
Installing the example application stacks:
From the cloned directory, execute:
kubectl apply -f pre
Included in the pre folder, there is an application that will be used in the exercises during the workshop. The diagram below shows how the elements of this application communicate between themselves.
There are also other objects that will be created. We will learn about them later in the workshop.
Note: Wait until all the pods are up and running to move to the next step.
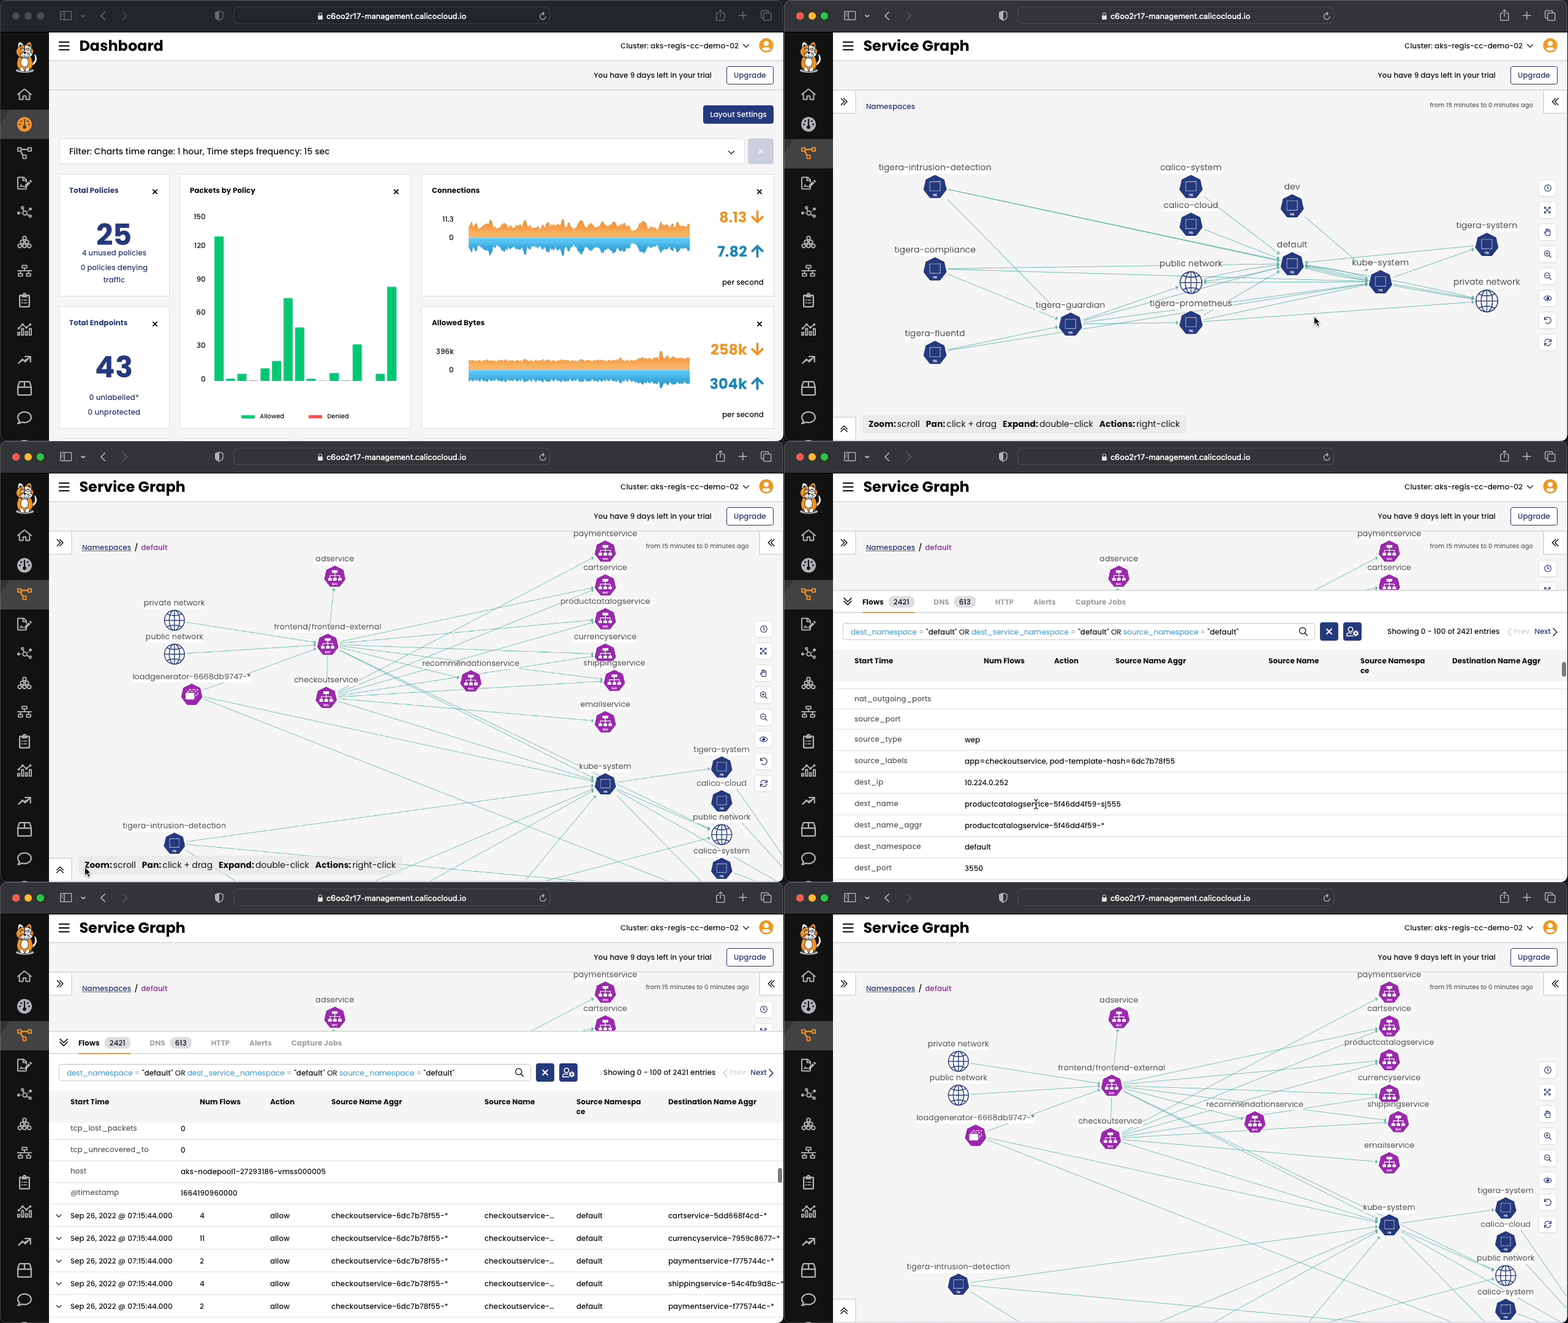
A common challenge expressed by DevOps engineers, Site Reliability Engineers (SREs), and platform operators is the difficulty in gaining fundamental insights within their Kubernetes cluster. With the proliferation of applications, microservices, and ever-changing workloads in the complex multi-tenant environment, it becomes increasingly challenging to comprehend the interplay of these components. Service Graph offers a visual representation, akin to a "weather map," that encompasses the entire cluster. It aids in swiftly onboarding new team members by illustrating the communication pathways between different elements, while also providing a straightforward means to involve the appropriate stakeholders when issues arise. Service Graph delivers a detailed, point-to-point, topographical perspective of how namespaces, services, and deployments interact with one another.
Connect to Calico Cloud GUI. From the menu, select Service Graph > Default. Explore the options.
Flow Visualizer, an essential tool within Calico Cloud, serves as a valuable resource for delving into network traffic within the cluster with the goal of resolving issues. The primary and widely-used function of Flow Visualizer is to provide an in-depth analysis that identifies the specific policies responsible for either permitting or blocking traffic between different services.
Connect to Calico Cloud GUI. From the menu select Service Graph > Flow Visualizations. Explore the options.
⬅️ Module 3 - Malware protection, access control and quarantine with Thread Defence
➡️ Module 1 - Connect the AKS cluster to Calico Cloud
↩️ Back to Main


