Are preemptible nodes and autoscaling acceptable? #69
Comments
|
Hi Chris,
The system is designed to run on preemptible instances without losing tasks
if you use the SQS based task queue. In fact, we only use preemptible
instances. Make sure to set the lease time to something longer than the
usual run time of the tasks. If you set it too short, as the queue runs
down vCPUs will become unoccupied and the task will start to replicate
until your entire cluster is performing duplicative work.
We never really tried autoscaling, though you can give that a shot. The CPU
utilization depends on the task and its ratio of computation to IO. For
example, skeletonization runs at nearly 100% utilization. The current
segmentation downsampling job I'm running is at around 86% utilization
after stabilizing. Generally speaking though, I pick a set number of
preemptible instances and load them with pods 1:1 with the number of CPUs,
though sometimes I might run a little lighter just to give more memory for
particular task configurations. The kinds of jobs Igneous runs are batch
jobs, so there isn't a dynamic load you'd want to accommodate with scaling.
You'll want to run at max power modulo ramping time for GCS's backend if
you run a large enough job.
If you need with figuring out the right provisioning for a task let me know.
Will
…On Sun, May 31, 2020 at 8:31 PM Chris Roat ***@***.***> wrote:
This is likely something that can be mentioned in the documentation
somewhere, and I'm happy to do it. I'm thinking ahead to a situation with a
k8s pod auto-scaling on top of an auto-scaling node pool with pre-emptible
instances.
If I use pre-emptible nodes, which are much cheaper, will I run into any
issues dropping messages?
Would it work to put a horizontal pod scaler, like the following, in the
deployment yaml? If so, what is a decent target CPU, based on prior
experience?
------------------------------
apiVersion: autoscaling/v1
kind: HorizontalPodAutoscaler
metadata:
name: igneous
spec:
scaleTargetRef:
apiVersion: apps/v1
kind: Deployment
name: igneous
minReplicas: 1
maxReplicas: 320
targetCPUUtilizationPercentage: 80
—
You are receiving this because you are subscribed to this thread.
Reply to this email directly, view it on GitHub
<#69>, or unsubscribe
<https://github.com/notifications/unsubscribe-auth/AATGQSPXWWNJ7CQUR7AL6VTRULZGFANCNFSM4NPMSSZQ>
.
|
|
Thanks for the info. The gcloud command for creating the cluster in the README didn't use pre-emptibles. I will send an update for that. Is there anything else in that command that could be updated? Are all the scopes necessary? Is using 'gci' for the image type doing anything? (Also, the logs indicate that using the /secrets mount point is deprecated in favor of /root/.cloudvolume -- is that recommended now?) I'm looking at using auto-scaling because we have a pipeline pumping out data at a semi-regular basis, and I want it to scale up for a load, and down between batches. It's less about managing load then about being able to "set it and forget it". The tasks are all downscales at the moment, and I'm seeing about pretty continuous usage of 1.5 CPU and 5G RAM for our pods. |
|
Are there any logs or monitoring that would point me to the task timing? The deployment.yaml has LEASE_SECONDS of 800. |
So that command probably needs a few updates. ^_^ I last touched it probably in 2017, usually I've been using the GUI to create new clusters. It's a good idea to update it. The main things would be:
I'm not sure what GCI is.
You can try playing around with that, but /secrets has been easy and reliable for me to set up so I have no intention of deprecating that function in the near future.
You can track the length of time jobs take by watching SQS and noting the burn down rate over a few minutes. If GCP logging is enabled correctly, you should be able to see tasks emitting an "executed in X seconds" message. I haven't used this feature in a while as I have been relying more on |
|
The cluster is running OK by using with 2 core jobs, but I'd like to make everything a bit more optimal. I'm writing my original cloudvolume via dask, and then submitting transfer tasks (which I use to rechunk more finely, plus do downsampling). The cores seem to be saturated on the downsample, so I'm going to increase that. The output from a single dask task (one core) is taking ~5 minutes for a 512x512x128x5 size uint16 image, using default compression. That seems quite slow -- it's probably the compression? I am going to try giving the dask task extra cores, as the monitoring seems to indicate it's saturating the thread. The size was just determined by what the upstream code was using. The default transfer task is 2048x2048x64. Should I use the default, and be storing the original in 2048x2048x64 chunks? |
|
What kind of downsampling are you using, averaging or mode pooling? I suspect you are encountering the slow numpy pathway instead of the accelerated path. |
|
I'm using the default that comes with My bigger initial concern is the initial output I'm making via dask. Does the 300s output for a 512x512x128x5 volume make sense? |
|
It depends only on whether it is segmentation or images images you're downsampling. It makes sense if you're hitting the slow path. The difference between the fast path and the slow path is documented to be 27x on one type of input: https://github.com/seung-lab/tinybrain/#example-benchmark I'm going to play around with this for a sec and see if I can reproduce your problem. It occurs to me... why x5? I'm familiar with x1 (grayscale), x2 (xy), x3 (rgb or xyz), but that's a new one for me. |
|
Superficially, it looks like the problem isn't tinybrain on my laptop. Both averaging and segmentation run very quickly. Let me try Igneous proper now. |
|
These are uint16 images. Its 5 channels because we are measuring florescence signal at different wavelengths. We actually sample many more (after different chemistry is done), but the acquisitions are 5-at-time. So there are two things here:
|
|
Are you able to reproduce it with this simple script? This took me 18 seconds. import numpy
from cloudvolume import CloudVolume
import igneous.task_creation as tc
from taskqueue import MockTaskQueue
field = np.random.randint(0,2**15, size=(512,512,128,5), dtype=np.uint16)
cv = CloudVolume.from_numpy(field, layer_type='image', compress='gzip')
print(cv.cloudpath)
tasks = tc.create_downsampling_tasks(
cv.cloudpath, mip=0, fill_missing=False, num_mips=3,
)
tq = MockTaskQueue()
tq.insert_all(tasks) |
|
We might be talking past each other. I have no timing info on the downsampling, which is done on an igneous cluster. My first is about the transfer task and what the optimal settings are for chunk sizes on my initial output. (The default transfer is of 2048x2048x64 -- is that pretty reasonable?) The timing of 300s is in writing out a 512x512x128x5 volume from a 1-core dask worker. I assume all this time is compression, and wonder what knobs there are to speed this up. The parallel flag seems to only be used for up/download. Each worker is outputting a single chunk, so I don't need that parallism. |
|
Yeah, my quick-and-dirty change to turn of compression (assuming nothing else changed in the environment), means my initial outputs are 6s each, rather than 300s. Of course, it's 3x bigger! I'm not sure what about the environment (a dask worker is pretty simple) makes this happen. I'll look into the transfer/downsampling performance next. What's the best way to see what an igneous task is doing? I haven't uses SQS (except for this), but I'll poke around and see if there are stats on task length. |
|
The igneous tasks do a 2048x2048x64 fetch (the default) and downsample with chunks 128x128x16 -- 4 mip levels. Just looking at how long between a message is first taken in and messages start deleting is definitely 30+ minutes. That does not seem right. :/ |
|
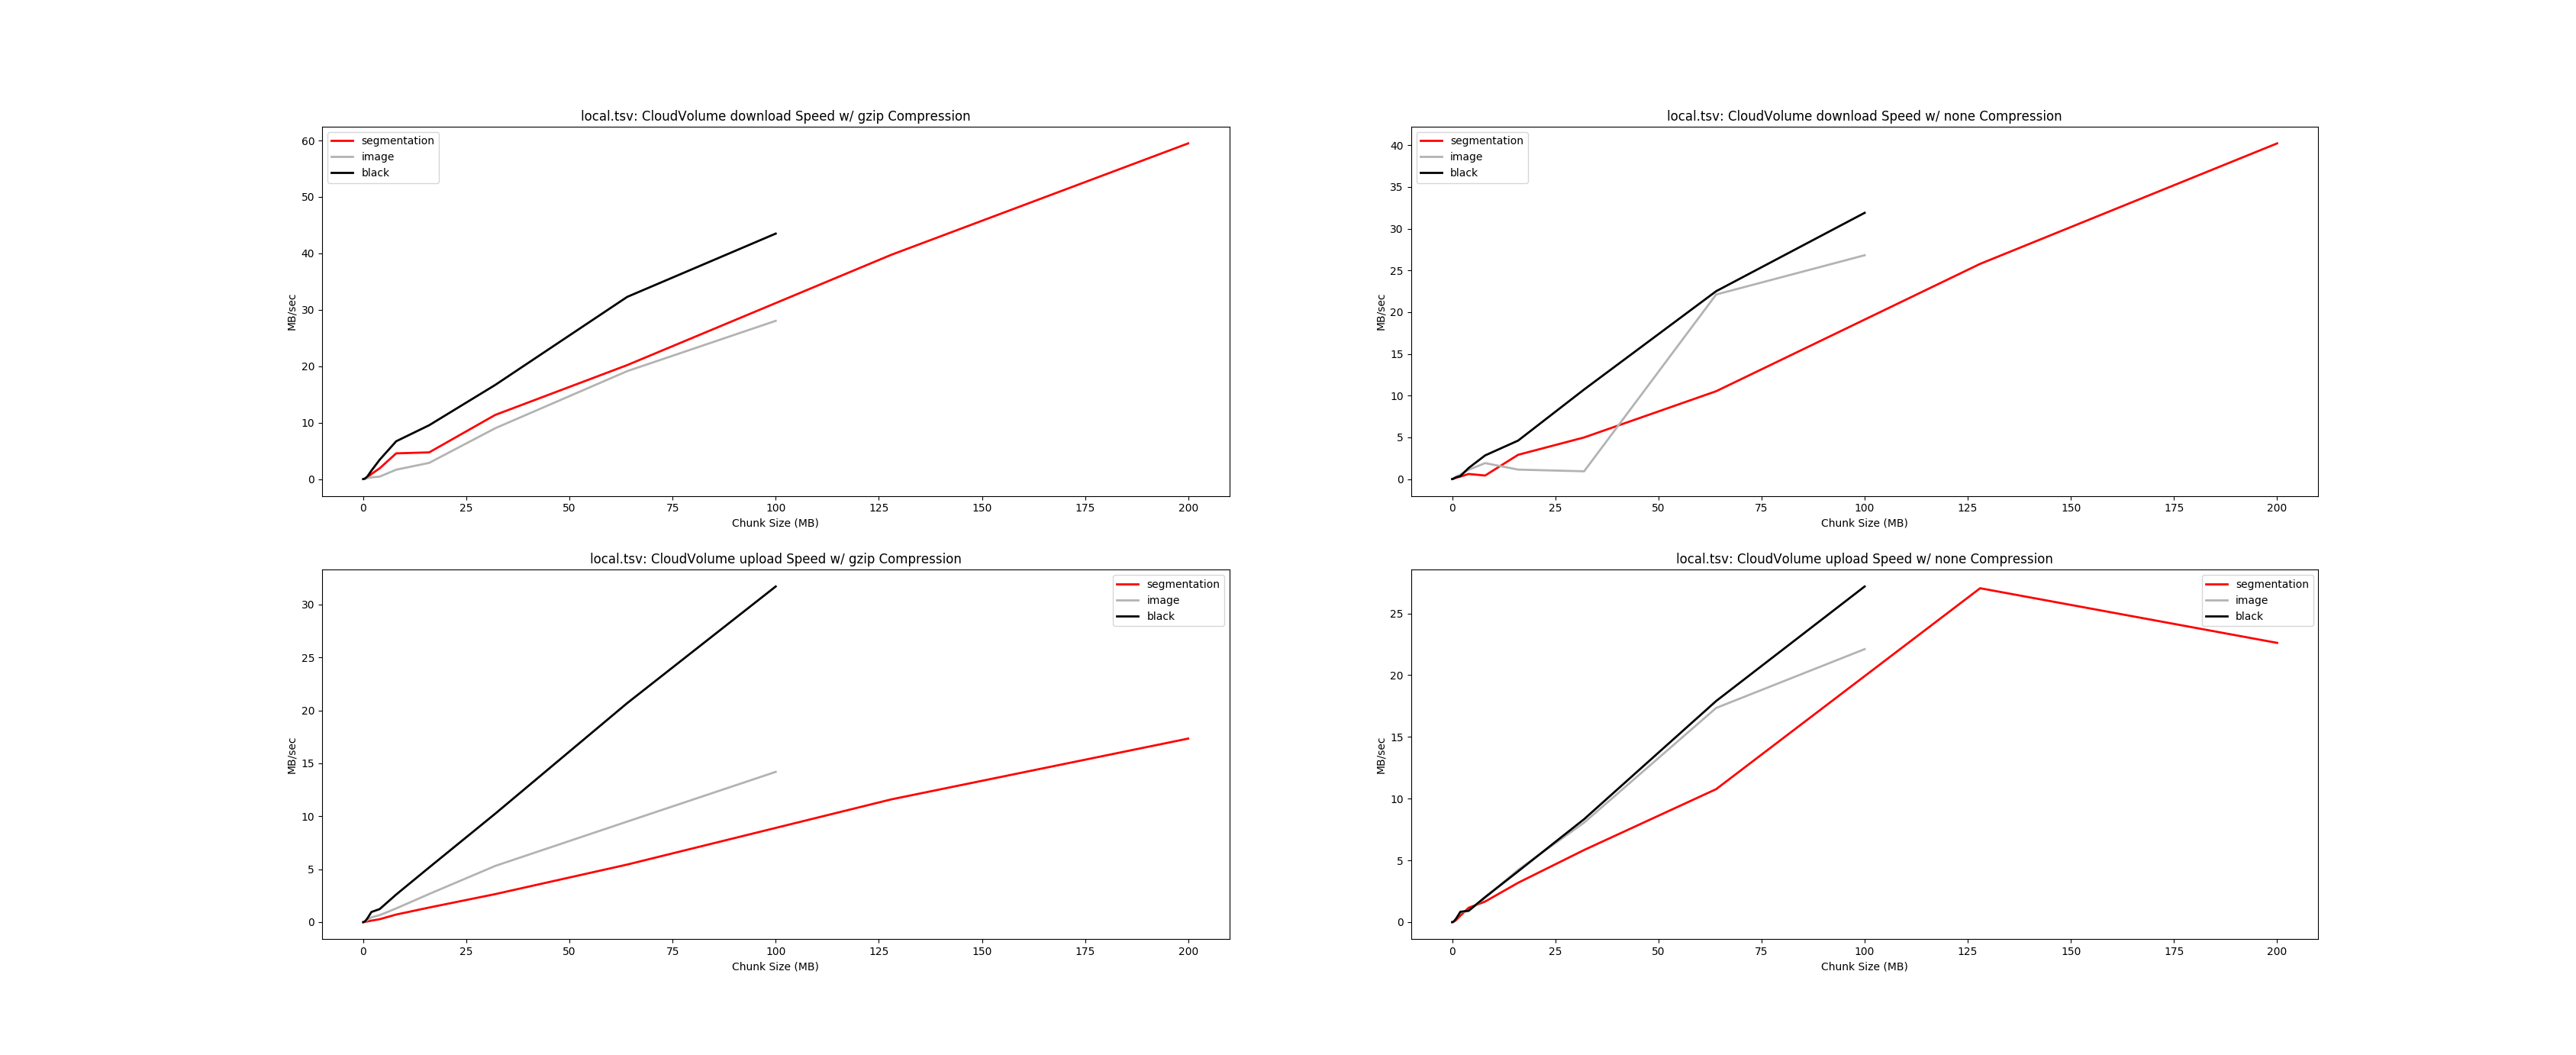
You can see how long a TransferTask takes by watching the progress bar from LocalTaskQueue. If that doesn't work for some reason, try setting parallel=1 and then try MockTaskQueue if that doesn't work. 128x128x16 chunks are pretty small. We often use 256x256x32. When you use very small files, the FS often doesn't deal with it as well and you see a loss of performance. However, it's clear that compression is somehow a problem. When I encounter these problems, I often use Generally speaking my rule of thumb is that, gzip compresses image data at about 12 MB/sec and decompresses at about 18 MB/sec. The numbers could be different by about a factor of two but will give us a ballpark estimate. Here's a CloudVolume upload benchmark: https://raw.githubusercontent.com/seung-lab/cloud-volume/master/benchmarks/local.png 2048 x 2048 x 64 voxels x 5 channels x 2 bytes / 1024^2 = 2560 MB 2560 MB / 18 MB/sec = 142 seconds to download 2560 MB / 3 = 853 MB downsamples 853 MB / 12 MB/sec = 71 sec. 142 sec + 71 sec = 213 seconds for gzip IO You can try reducing the compression level, though that's not a built in option to TransferTask. That would net you probably a factor of two improvement or so. You can also adjust the shape parameter to be a power of two multiple of the chunk size to make individual tasks faster. (2048, 2048, 16) would be 4x faster and return the same number of mip levels. |
|
Thanks for the extensive numbers. On the creation of the original chunks from my dask pipeline, I'm making them 512x512x128. This is the point where I found the gzip was killing me. That's 2x smaller than your 1024x1024x64 estimate, and just compression. I suspect I'm hitting another bottleneck. At this point in my optimizations, i don't mind turning off gzip and having my original volumes being 3x bigger, given the time savings. I can revisit later. Now turning to the transfer+downsample. Looking at the queue burn down and the CPU usage of each task (which has a periodicity at the timescale of a task), I estimate it's running 8-9 minutes per task and nearly fully utilizing 16 cores, or about ~8k core-seconds. This is for the 1024x1024x64 size you calculate above, but it doesn't have to decompress (since that is off during initial compression). How does that 8000 core-seconds sound? I'm not sure what it could be doing. The core part of the code just the tinybrain.downsample_with_averaging, right? This runs very fast: [As an aside, I did realize I had a mismatch in sizes. My dask pipeline outputs chunks of 512x512x128, but the transfer task is setup to read in 1024x1024x64. I think the z-mismatch means it read each chunk in two different transfers. :(] |
|
8-9 minutes per a task sounds pretty crazy for this kind of computation. I think I don't precisely understand the way Dask and Igneous are interacting. How are you actually executing the Igneous tasks? Would you be able to profile various parts of the TransferTask in tasks.py? You can do: You have to decorate the various functions you want to profile with |
|
Dask and Igneous do not interact. I was worried we kept talking past each
other. There are two things here:
1. Dask writes out the original volumes (512x512x128). It's super-duper
slow when compression is on. I've turned off compression.
2. Igneous cluster transfers and downsamples/rechunks/compresses - 4
mips (plus rewriting the original) at 128x128x16. This seems to take 8
minutes on 16 cores for a task. Since it's saturating the cores, I don't
think it's I/O.
I am running Igneous via the docker image. Maybe I can figure out a way to
profile this situation.
seunglab/igneous@sha256
:56d5e6c92af2ba8088b213875abe63058ff985218d18f0d1f8adb00a4a9c9523
One thing I'll note is that our lowest resolution is missing data. The
right- and bottom- sides seem to be missing. Perhaps we tickled something
that causes the incomplete tiles not to be created? Probably unrelated to
the problems above, but you never know....
C
…On Fri, Jun 12, 2020 at 5:36 PM William Silversmith < ***@***.***> wrote:
8-9 minutes per a task sounds pretty crazy for this kind of computation. I
think I don't precisely understand the way Dask and Igneous are
interacting. How are you actually executing the Igneous tasks? Would you be
able to profile various parts of the TransferTask in tasks.py? You can do:
pip install line_profiler
kernprof -l SCRIPY.py
python -m line_profiler SCRIPT.py.lprof
You have to decorate the various functions you want to profile with
@profiler <https://github.com/profiler>. Can you execute Igneous without
Dask?
—
You are receiving this because you authored the thread.
Reply to this email directly, view it on GitHub
<#69 (comment)>,
or unsubscribe
<https://github.com/notifications/unsubscribe-auth/AAIBDYN364SVXKZN2NNKRMTRWLCZXANCNFSM4NPMSSZQ>
.
|
This is likely something that can be mentioned in the documentation somewhere, and I'm happy to do it. I'm thinking ahead to a situation with a k8s pod auto-scaling on top of an auto-scaling node pool with pre-emptible instances.
If I use pre-emptible nodes, which are much cheaper, will I run into any issues dropping messages as nodes come and go?
Would it work to put a horizontal pod scaler, like the following, in the deployment yaml? If so, what is a decent target CPU, based on prior experience?
apiVersion: autoscaling/v1
kind: HorizontalPodAutoscaler
metadata:
name: igneous
spec:
scaleTargetRef:
apiVersion: apps/v1
kind: Deployment
name: igneous
minReplicas: 1
maxReplicas: 320
targetCPUUtilizationPercentage: 80
The text was updated successfully, but these errors were encountered: