(What are?) probabilities in a distribution always add up to 1.
- A very wordy explanation (figure2)
Comparing distributions:
- Kolmogorov smirnov not good for categoricals.
- Comparing two
- Khan academy
- Visually
- When they are not normal
- Using train / test trick
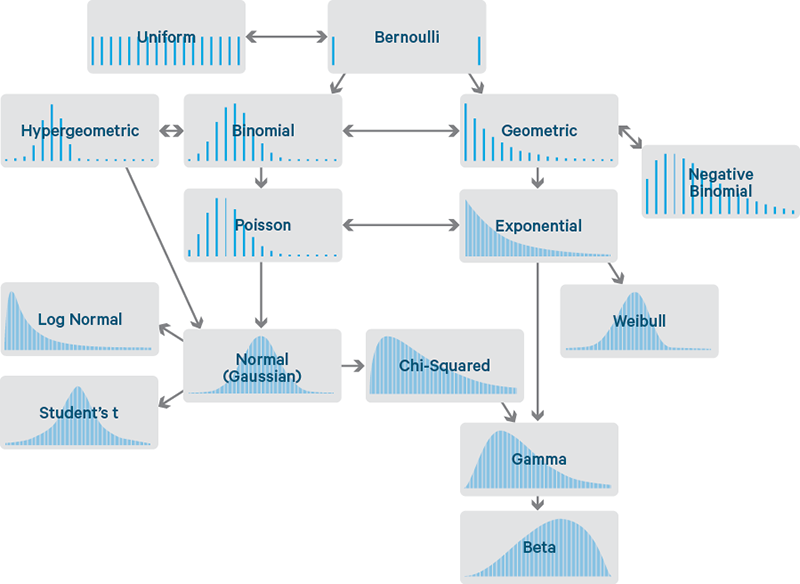
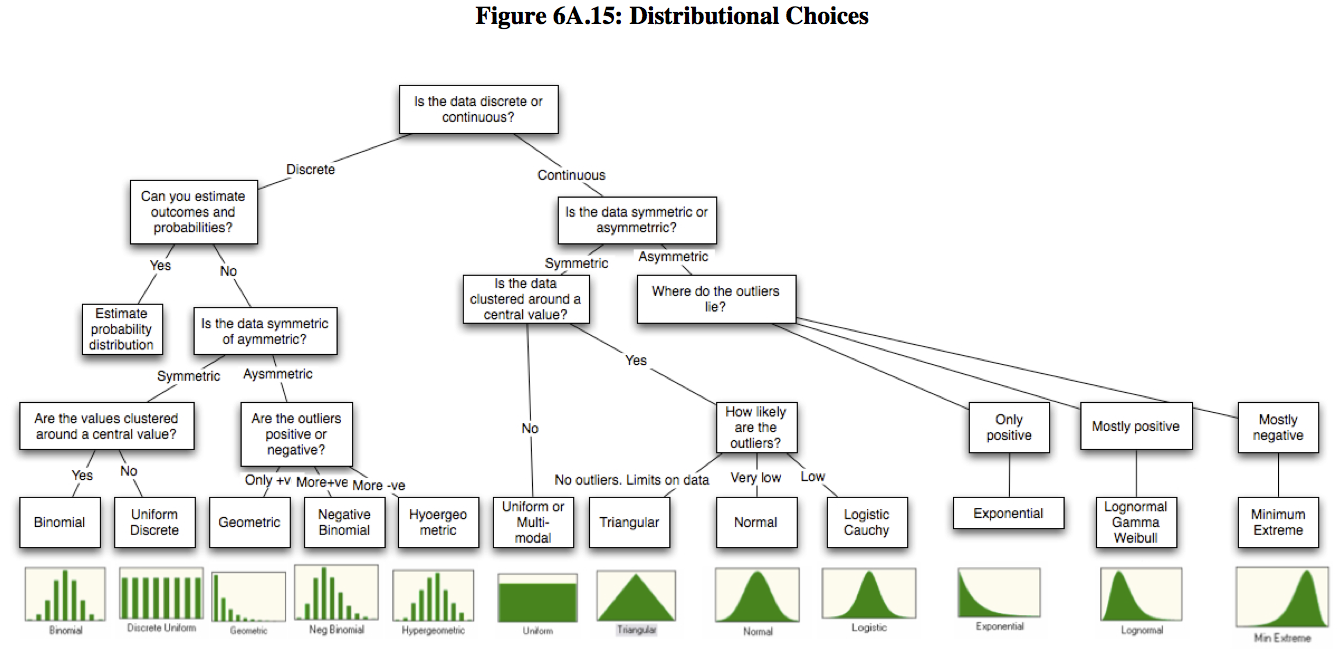
- Code for Identifying distribution type and params, based on best fit.
“ if you collect data and it is not normal, “you need to collect more data”\
The normal distribution is popular for two reasons:
- It is the most common distribution in nature (as distributions go)
- An enormous number of statistical relationships become clear and tractable if one assumes the normal.
Sure, nothing in real life exactly matches the Normal. But it is uncanny how many things come close.\
this is partly due to the Central Limit Theorem, which says that if you average enough unrelated things, you eventually get the Normal.\
- the Normal distribution in statistics is a special world in which the math is straightforward and all the parts fit together in a way that is easy to understand and interpret.
- It may not exactly match the real world, but it is close enough that this one simplifying assumption allows you to predict lots of things, and the predictions are often pretty reasonable.
- statistically convenient.
- represented by basic statistics
- average
- variance (or standard deviation) - the average of what's left when you take away the average, but to the power of 2.
In a statistical test, you need the data to be normal to guarantee that your p-values are accurate with your given sample size.
If the data are not normal, your sample size may or may not be adequate, and it may be difficult for you to know which is true.\
- Categorical data can be transformed to a histogram i.e., #class / total and then measured for distance between two histograms’, e.g., train and production. Using earth mover distance python git wrapper to c, linear programming, so its slow.
- Earth movers.
- EMD paper
- Also check KL DIVERGENCE in the information theory section.
- Bengio et al, transfer objective for learning to disentangle casual mechanisms - We propose to meta-learn causal structures based on how fast a learner adapts to new distributions arising from sparse distributional changes