| layout | keywords | comments | title | description | <!-- author | micro_nav | ||||||||
|---|---|---|---|---|---|---|---|---|---|---|---|---|---|---|
default |
false |
Data Informed Design Approach |
a systematic approach to the development and evolution of products and services |
|
true |
Data informed design is a systematic approach to the development and evolution of products and services. Use data to inform your decisions instead of
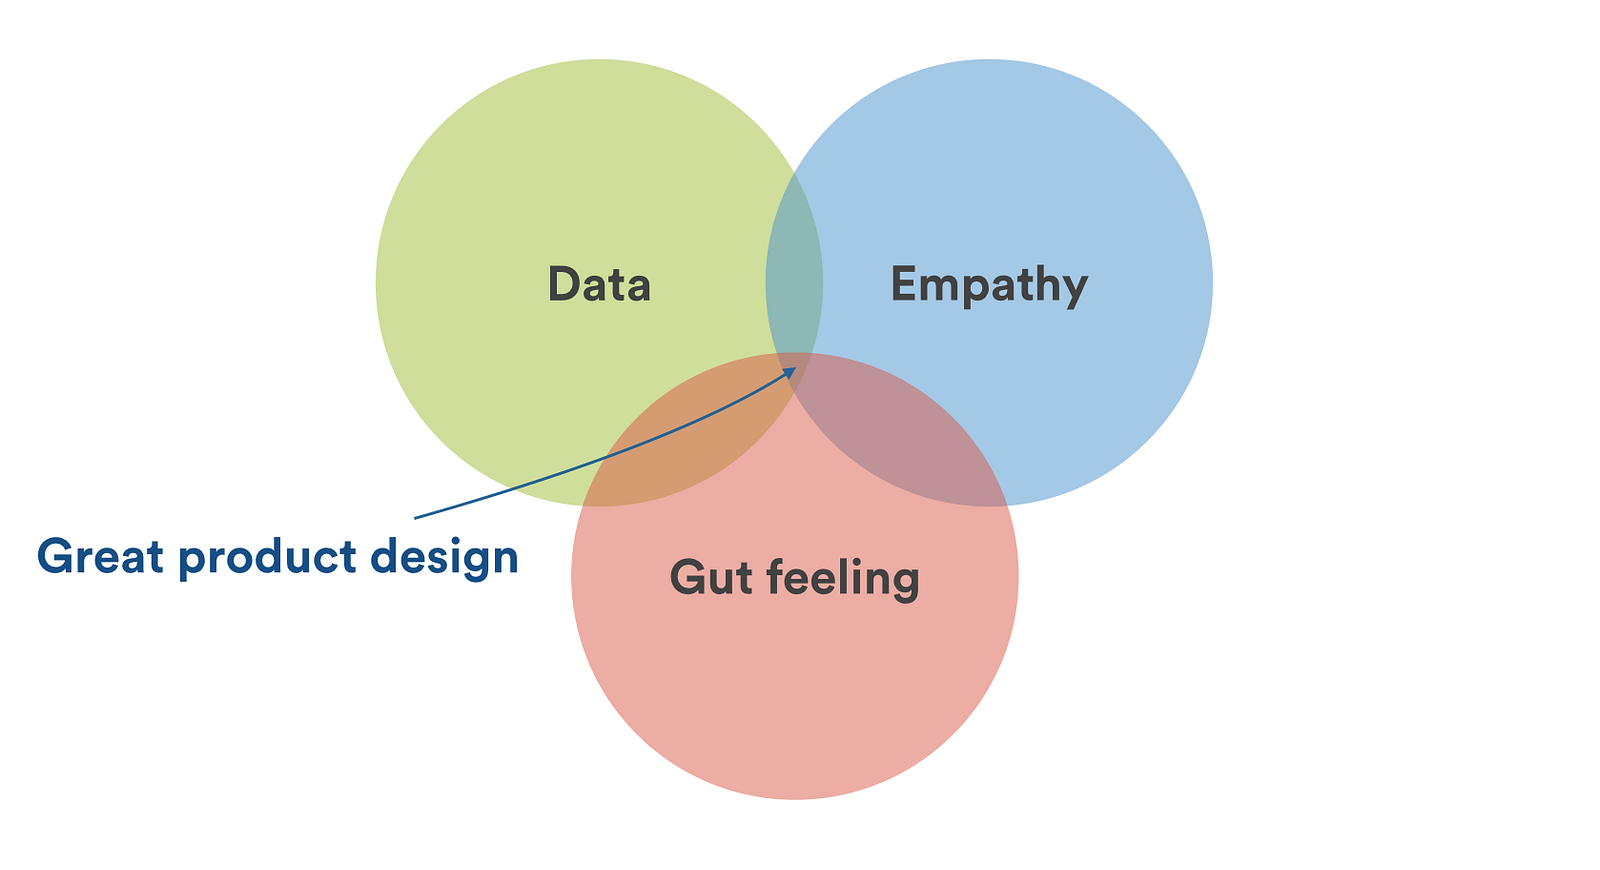
The difference between data-driven and data-informed is subtle but important in my opinion, and data-informed is perfectly depicted by this Venn diagram, which I borrowed and tweaked from Josh Porter:
Decisions for design should be informed by data. Data can be anything from conversion, engagement, time spent in product, feature usage, net promoter scores (NPS)
- Quantitative data tells you WHAT is or isn’t happening. Analytics and data show us what people do on their own, but it doesn’t tell us about the users context, motivations, and intent.
- Qualitative data helps you better understand WHY it is or isn’t happening.
Quantitative data is a good tool for understanding what is happening but it won't tell you why. For that, you often need to turn to qualitative data (talking to people). You can ask people with in-context small surveys and similar techniques.
Good product design comes from striking the right balance between data, empathy and intuition.
Data:
Data provides the “what”.
Empathy
Empathy can be built up by reading NPS feedback quotes, interviewing customers, surveys and more traditional ethnographic research methods, like contextual inquiries or usability testing. Again though, that empathy is useless without meaningful insights.
Empathy provides the “why”.
Gut feeling / intuition
There is a great quote from Julie Zhuo, the Facebook product design director:
Data and A/B test are valuable allies, and they help us understand and grow and optimize, but they’re not a replacement for clear-headed, strong decision-making. Don’t become dependent on their allure. Sometimes, a little instinct goes a long way.
Intuition provides the “how”.
Google Analytics can tell us what happens when a user comes to the pages directly. We also need to understand happens when a user comes to that page through other pages, and what happens after he takes an action to download one ebook.
- Page views and visits
- Most trafficked pages
- Traffic by type and source (organic, referral, direct, social media, keyword drivers)
- Highest ranking SERP pages
- Bounce and exit rates
- Time on site
- Content performance
- Behavior flow
- Conversions (subscribers, inquiries, sales, etc.)
- Devices and browsers
- Demographics and geographies
Reviewing click-tracking heatmaps and session recordings and A/B testing.
Tools like Mouseflow, Clicktale, Hotjar, VWO, and Inspectlet include click, hover, and scroll reports along with recordings of users page interactions.
- Pages that have low traffic or a high bounce rate might indicate problems with page content. Identify changes to improve the page and set a goal to increase views or engagement.
- Improve high traffic pages with low engagement rates. Setting goals to improve these pages will have an impact on more visitors because more people are arriving at the page.
- NB: A high bounce rate is not necessary a bad thing, it could mean users found what they need.
- A/B testing can then be used to compare different design versions and determine which one is more successful.
Whenever you are designing an experience you need to ensure you know what data point you are optimising for and if it is a leading or trailing metric. You should only try to optimise for one metric, but you should also monitor other secondary metrics in your product. Again, the key is getting customer insights from your data.
Pro tip: Read more about how to run experiments
Good product design comes from striking the right balance between data, empathy and intuition. You need an understanding of the feedback you get from data and research, and a gut feel of what is right or wrong. Data should not paralyse any designer or remove their creative freedom. Understand that neither one of these inputs will tell us what to design and build.
Data-driven vs. data-informed design in enterprise products
