Skip to content
New issue

Have a question about this project? Sign up for a free GitHub account to open an issue and contact its maintainers and the community.

By clicking “Sign up for GitHub”, you agree to our terms of service and privacy statement. We’ll occasionally send you account related emails.

Already on GitHub? Sign in to your account

Maintain the order of the nodes in Flowchart #815

Closed
vidur149 opened this issue Mar 30, 2019 · 34 comments
Closed

Maintain the order of the nodes in Flowchart #815

vidur149 opened this issue Mar 30, 2019 · 34 comments
Assignees
Labels
Graph: Flow Status: Approved Is ready to be worked on

Comments

@vidur149
Copy link

vidur149 commented Mar 30, 2019

I have defined a graph as follows ->

graph TD
linkStyle default interpolate basis
subgraph 
A[gunung]-->B[NOUN]
C[Krakatau]--> D[NOUN]
E[Yang]-->F[PRON]
G[Pernah]-->H[ADV]
I[meletus] --> J[VERB]
K[mulai]-->L[VERB]
M[terbatuk-batuk] --> N[VERB]
end
subgraph 
  B --> O[FN]
  D --> O
  F --> O
  J --> O
  L --> P[FV]
  N --> P
end
subgraph 
  O --> Q[Subject]
  P --> R[Predicate]
end
subgraph 
 Q-->S[clause]
 R-->S
end

Editor Link
I need to preserve the order of the nodes. I defined Pernah before Yang but it comes in the end. Please help, on how to maintain the order of the nodes. Thanks. It would really help me achieve everything I ever wanted :p.

@spex66
Copy link

spex66 commented Apr 9, 2019

not ideal, but adding a sub-subgraph around your terms from the FN clause, the order will be preserved

graph TD
linkStyle default interpolate basis
subgraph 

subgraph FN
A
C
E
G
I
end

A[gunung]-->B[NOUN]
C[Krakatau]--> D[NOUN]
E[Yang]-->F[PRON]
G[Pernah]-->H[ADV]
I[meletus] --> J[VERB]
K[mulai]-->L[VERB]
M[terbatuk-batuk] --> N[VERB]
end

subgraph 
  B --> O[FN]
  D --> O
  F --> O
  J --> O
  L --> P[FV]
  N --> P
end
subgraph 
  O --> Q[Subject]
  P --> R[Predicate]
end
subgraph 
 Q-->S[clause]
 R-->S
end

@stale
Copy link

stale bot commented Jun 29, 2019

This issue has been automatically marked as stale because it has not had recent activity. It will be closed if no further activity occurs. Thank you for your contributions.

@stale stale bot added the Type: New Shape Request for new shape label Jun 29, 2019
@knsv
Copy link
Collaborator

knsv commented Jun 30, 2019

Hi! Sorry for the slow response.

The posisitioning of the nodes are done by a layout algorithm and sometimes that one is not perfect and worksarounds like the one is required. I am aware of this but is not easy to fix. I have half an idea of adding more layout algorithms and the possibility to pick the one thats best fits a particular use case.

The project has got good traction but it also means that it is very hard to manage all issues on your spare time. I am trying to get a bigger team together for faster development and better support #866. I am closing this one for now, not out of disrespect but as a part of an effort to clean out stale issues that has been resolved but not closed.

Is this still a problem? If so please reopen it.

@knsv knsv closed this as completed Jun 30, 2019
@yozachar
Copy link

yozachar commented Jun 19, 2020

Hi I'm having the same issue.

I need to preserve the order of the nodes else the parse-tree (to parse a string like 2 + 3 * 4 ) won't work.

graph TD
E(E)
E1(E)
E2(E)
T(T)
T1(T)
T2(T)
F(F)
F1(F)
F2(F)
_P(+)
_S(*)
_D(num)
_D2(num)
_D3(num)

E --> E1
E --> _S
E1 --> T
T --> F
F --> _D
E1 --> E2
E2 --> T2
T2 --> F2
F2 --> _D2
E1 --> _P
E --> T1
T1 --> F1
F1 --> _D3

Btw is there a way to optimize (in every sense) the above mermaid graph to yield the following figure.

Here + needs to be move to middle & it's siblings on either sides, with the longer one on the left.

Expected Graph Resultant Graph
Chart

Ah... don't mind the directed arrows

@spex66 sorry, I didn't get the idea of sub-graphs.

@danitrod
Copy link

danitrod commented Jun 24, 2020

I am having the same problem as @joe733. I have to do a parse-tree for a college class and I wanted to use mermaid, but I will have to switch to another software because of the messed up ordering.

@XertroV
Copy link

XertroV commented Jul 2, 2020

I have a similar issue to @joe733 and @danitrod

note: I'm automatically converting whitespace indented s-expressions (though cheating because I strip out parens and just use whitespace)

Here's an example:

(edit: the grammar-tree here is wrong; 'has' should be the root, not 'bothered')

image

spamming subgroups does seem to work:

image

but is ugly. Might try and patch mermaid.js to draw "invisible" boxes around subgroups with "#nbsp;" as their name. Oh and fix the phantom subgroups that show up.

source code (tree stuff is in docs/_layouts/default.html): https://github.com/xertrov/fi

Also, this is the generated mermaid code for the 2nd graph:

graph TD
r["bothered :: verb, linking"]
subgraph sg.r ["#nbsp;"]
r --- r.0["has :: aux verb"]
subgraph sg.r.0 ["adverbial"]
r.0 --- r.0.0["been :: aux verb"]
subgraph sg.r.0.0 ["#nbsp;"]

end
r.0 --- r.0.1["ever :: adverb"]
subgraph sg.r.0.1 ["#nbsp;"]

end
end
r --- r.1["nobody :: pronoun"]
subgraph sg.r.1 ["#nbsp;"]

end
r --- r.2["by :: preposition"]
subgraph sg.r.2 ["adverbial"]
r.2 --- r.2.0["being :: gerund"]
subgraph sg.r.2.0 ["#nbsp;"]
r.2.0 --- r.2.0.0["dead :: adjective / object of 'being'"]
subgraph sg.r.2.0.0 ["#nbsp;"]

end
end
end
end

@XertroV
Copy link

XertroV commented Jul 2, 2020

🎉 XertroV@aa670ef

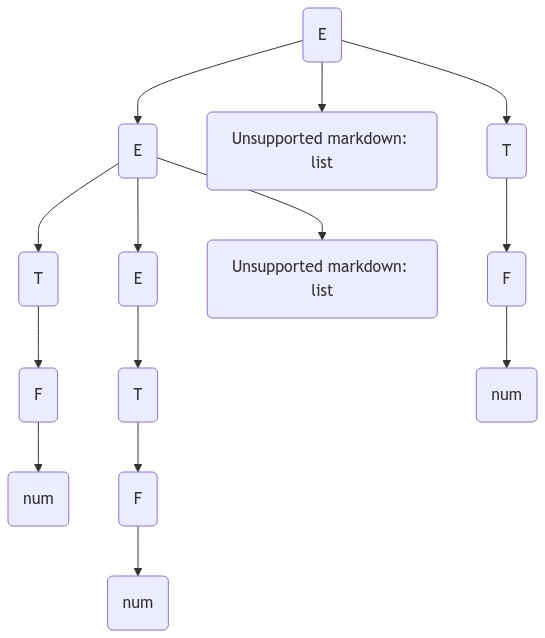
Invisible subgroups to force ordering:

image

It does stretch out the graph a bit, but works for my purposes

a side effect is that sub-trees will now not overlap vertically, which might or might not be good:

(in this example I'd put those two labeled subgraphs in to force this so it was easier to read)

image

rendering example from @joe733 above

image

with generated code:

graph TD
r["e "]
subgraph sg.r ["#nbsp;"]
r --- r.0["E "]
subgraph sg.r.0 ["#nbsp;"]
r.0 --- r.0.0["E "]
subgraph sg.r.0.0 ["#nbsp;"]
r.0.0 --- r.0.0.0["T "]
subgraph sg.r.0.0.0 ["#nbsp;"]
r.0.0.0 --- r.0.0.0.0["F "]
subgraph sg.r.0.0.0.0 ["#nbsp;"]
r.0.0.0.0 --- r.0.0.0.0.0["num"]

end
end
end
r.0 --- r.0.1["+"]

r.0 --- r.0.2["T"]
subgraph sg.r.0.2 ["#nbsp;"]
r.0.2 --- r.0.2.0["F"]
subgraph sg.r.0.2.0 ["#nbsp;"]
r.0.2.0 --- r.0.2.0.0["num"]

end
end
end
r --- r.1["*"]

r --- r.2["T"]
subgraph sg.r.2 ["#nbsp;"]
r.2 --- r.2.0["F"]
subgraph sg.r.2.0 ["#nbsp;"]
r.2.0 --- r.2.0.0["num"]

end
end
end

@Polirecyliente
Copy link

Polirecyliente commented Apr 17, 2021

I spent some time looking for a solution to this, and @XertroV answer served for me, so I'm going to write the search terms I used in hope that search engines show this Issue if someone searches for a solution, because search engines show a lot of sea mermaids and not a lot of diagram layout.

Also, in my opinion @XertroV answer would be a good addition to the documentation, maybe trim down the example to a minimal working example, but yeah it's a good example about how to maintain the layout in a given order.

Mermaid layout nodes
Mermaid layout elements
Mermaidjs layout elements
Mermaid position elements
Mermaidjs position elements
Mermaid keep elements in position
Mermaid keep layout
Mermaidjs keep layout

@Polirecyliente
Copy link

Polirecyliente commented Apr 17, 2021

You know what? On second thought I will share my case, it doesn't cost me anything.

First of all lets show the need for this solution. Normally, Mermaid nodes that are defined first are placed higher in the hierarchy. This can be overridden by Mermaid itself when there are subgraphs present, because for some reason subgraphs get higher levels in the hierarchy of nodes, even if they are defined after and should therefore come after in the hierarchy.

The basic black box process diagram shows a process as a "black box", in which the process receives inputs and produces outputs. Also, a "black box" process can feed itself by connecting its output to its input. The straightforward way to write a "black box" process diagram (that feeds itself) in Mermaid is:

flowchart LR
  Input --> Process
  subgraph Process
    A --> B --> C --> A
  end
  Process --> Output
  Output --> Input

This produces the following image:
o2

As can be seen, the Input is not in to the left anymore, because its place in the hierarchy has been taken by the subgraph.

Giving credit to @XertroV the fixed Mermaid code is

flowchart TB
  Input
  subgraph s1 [" "]
    Input --> Process
    subgraph s2 [" "]
      subgraph Process
        A --> B --> C --> A
      end
      Process --> Output
    end
  end
  Output --> Input
  
  classDef class1 fill: white, stroke: white
  class s1,s2 class1
  style Process fill: white, stroke: black

o1

This correctly shows the "black box" process between the inputs and the outputs.

@ferrieux
Copy link

ferrieux commented Jun 8, 2021

@knsv

Is this still a problem? If so please reopen it.

Yes, it is a show stopper. I heavily invested on Mermaid for flowcharts, the idea is absolutely neat, but devil in details like this one end up killing the whole experience:

  • impossible to even predict (let alone force, as suggested here) node layout
  • same for arrows that randomly zigzag when crossing subnet boundaries
  • impossible to touch node padding (it is not a CSS attribute, it is hardcoded in SVG geometry)

I'd suggest replacing the complicated/unmaintainable algorithm with a simple, predictable and documented one: this way, granted, authors will need to work a bit more to reach their goals, but they'll end up with the job done instead of banging their heads until they drop Mermaid.

@wizlee
Copy link

wizlee commented Jun 8, 2021

Comment here as a show of hand. A suggestion is perhaps to include this inside directives as a configuration.

@DuncanHills
Copy link

Started using mermaid inside our org for docs and ran into this issue.

@bjohas
Copy link

bjohas commented Jan 10, 2022

Same here.

@benoit-dubreuil
Copy link

Same

@matthiasg
Copy link

Same here :)

@jtbandes
Copy link

jtbandes commented Feb 23, 2022

I'm interested in the workarounds offered in this thread using subgraphs. However, I haven't found any combination of subgraphs that makes this example work.

First I have these nodes in order:

flowchart LR
subgraph foo
    foo1
    foo2
    foo3
end

Now I'd like to add an arrow from foo3 back to foo1, without changing the position of any nodes. But when I add an edge, the nodes move around:

flowchart LR
subgraph foo
    foo1
    foo2
    foo3 --> foo1
end
flowchart LR
subgraph foo
    foo1
    foo2
    foo3 --> foo1
end

How would I apply the subgraph workaround in this situation? I've tried subgraphs around lots of different groups of nodes, but nothing seems to allow me to make the nodes line up in their original order.

@StupydHors
Copy link

If somebody encounters this thread searching for a way to re-order columns in a sequence diagram I have settled upon just adding a simple Note over Actor1, Actor2: Title of the Sequence

@taranlu-houzz
Copy link

I came across this thread after hitting both this issue as well as the issue with subgraph direction being ignored (#2509). For me, these two issues combined are pretty much a show-stopper. I feel like having the ability to do something like this:

flowchart LR
    subgraph A
        direction TB
        ordered
        .
        .
        .
    end
    subgraph B
        direction TB
        ordered
        .
        .
        .
    end
end

Where both direction and ordered are strictly respected would solve a huge number of issues.

@jpl-jengelke
Copy link

jpl-jengelke commented Jul 13, 2022

Why is this closed? Node ordering remains very broken.

The recent example by @jtbandes is a straightforward example of the problem. None of the workarounds are successful. (Although declaring nodes in order in subgraph clauses seems to work mostly for my use cases.) There are no commits nor planning discussions here that address this critical shortcoming.

Auto-closing tickets because they age doesn't make the problem go away. ...

@Warfront1
Copy link

Warfront1 commented Jul 30, 2022

The most insidious aspect of this issue, is you can work on a diagram for a few hours, and make one connection that changes the whole shape of your chart.

My specific use case was tracking the flow of multiple electrical connectors with a chart.
The chart and nodes modeled the electrical connectors as you would see it in person (in a particular order)
Without proper ordering this chart is actually dangerous as it no longer resembles the real world object.
By the way, this is just a home small electronics project.

Here is another hacky work around:
Suppose you have two boxes (box1 and box2), each having two ports, that connect to each other in a crisscross fashion.
Observe the following mermaid chart you would attempt to create based on such a scenario.
Notice how the ports on the box1 ARE OUT OF ORDER (2 is presented before 1).

graph TB;
    subgraph box1
        box1_1[1]
        box1_2[2]
    end
    subgraph box2
        box2_1[1]
        box2_2[2]
    end

box1_2 --> box2_1
box1_1 --> box2_2
graph TB;
    subgraph box1
        box1_1[1]
        box1_2[2]
    end
    subgraph box2
        box2_1[1]
        box2_2[2]
    end

box1_2 --> box2_1
box1_1 --> box2_2

You can mess with the connections and then make the line associated 0 pixels (thereby making it invisible).
After a few attempts you may be able to get your graph good enough for your uses.
The lines generated by such a hack make it slightly odd looking, but certainly usable.

graph TB;
    subgraph box1
        box1_1[1]
        box1_2[2]
    end
    subgraph box2
        box2_1[1]
        box2_2[2]
    end

%% Start of Hack Work Around to Fix Ordering. https://github.com/mermaid-js/mermaid/issues/815
box1_1 --- box2_1 %% This is not a real connection, just used to hack/force order.
box1_2 --- box2_2 %% This is not a real connection, just used to hack/force order.
linkStyle 0 stroke-width:0px
linkStyle 1 stroke-width:0px
%% End of Hack Work Around to Fix Ordering

box1_2 --> box2_1
box1_1 --> box2_2

@knsv knsv reopened this Aug 20, 2022
@knsv
Copy link
Collaborator

knsv commented Aug 20, 2022

I'd suggest replacing the complicated/unmaintainable algorithm with a simple, predictable and documented one: this way, granted, authors will need to work a bit more to reach their goals, but they'll end up with the job done instead of banging their heads until they drop Mermaid.

I feel your pain! If I understand you correctly you are proposing a syntax for user controlled layout. Where you tell mermaid that A should positioned to the right of, or below of etc. That is interesting but would be new flowchart type.

I think there are two possible paths here:

  1. Improving tools like invisible lines, length of lines etc to help users modify the layout
  2. A new diagram type for manual layout

@knsv knsv added Status: Approved Is ready to be worked on Graph: Flow and removed Type: New Shape Request for new shape labels Aug 20, 2022
@ferrieux
Copy link

Hello Knut,

First, I'm very glad to see your interest in this. Here is how I would tackle it:

To me, the very core of the beauty and appeal of Mermaid, beyond its being an non-wysiwyg, ASCII, greppabble and diff-friendly format, is its simplicity. So, I'm rather reluctant to drop that by completely changing the format and inventing a new type; better to just add config options to convey constraints here and there.

Now what constraints exactly ?

  • your idea of line length is interesting; a variant could be "line strength", like a spring rigidity in physics, that would be easier to the human mind, and more scalable than lengths (when dozens of nodes are added to an existing graph)
  • invisible lines, on the other hand, would only be prorogating the existing mysterious effect of adding an edge, without making it any more predictable.
  • one very simple primitive I find myself wanting, is just "node A should be above / at the same Y position as node B (for a vertical layout)"; it might even be sufficient in 99.9% of cases. Bring in the same for X (still in a vertical layout) and you pretty much reach 100% ;)
  • maybe I'm missing a few corner cases ; I'm open to refining the mechanism when they show up.

What do you think ?

@knsv
Copy link
Collaborator

knsv commented Aug 21, 2022

That makes sense, I also like this option better. The trick is what you can and can not do with dagre. The first steps is deep dive there to find proper solutions. Meanwhile collecting and simplifying workarounds should also be done.

Collecting as in a troubleshooting guide in the docs etc.

@sidharthv96
Copy link
Member

Related: #3357

@knsv
Copy link
Collaborator

knsv commented Dec 7, 2022

Som action in this one now as the lazy loading is in place which opens up for more layout algorithms. I am comparing cytoscape and elk as additional layout algorithms. Elk seems very promising even though the library is huge.

For small diagrams all is well but with bigger ones elks is superior to the dagre algorithm currently in use.

Activation of this would something like flowchart elk LR or flowchart-elk LR.

knsv added a commit that referenced this issue Dec 10, 2022
knsv added a commit that referenced this issue Dec 11, 2022
knsv added a commit that referenced this issue Dec 16, 2022
@artk42
Copy link

artk42 commented Dec 27, 2022

@knsv that's awesome! how to give a test? i'm a bit new to the mermaid's dev process

@vidur149 vidur149 closed this as completed Jan 3, 2023
@Delfana
Copy link

Delfana commented Jan 12, 2023

I found a less complicated way to fix the example in #815 (comment).

The basic black box process diagram shows a process as a "black box", in which the process receives inputs and produces outputs. Also, a "black box" process can feed itself by connecting its output to its input. The straightforward way to write a "black box" process diagram (that feeds itself) in Mermaid is:

This produces the following image: o2

As can be seen, the Input is not in to the left anymore, because its place in the hierarchy has been taken by the subgraph.

I put the nodes in separate subgraphs and made the connections in the main graph.
It doesn't matter if the connections or the subgraphs are defined first. But the order of the subgraphs matters. I haven't figured out what the rules are though...

flowchart LR
    Input --> Process
    Process --> Output
    Output --> Input

    subgraph Process
      A --> B --> C --> A
    end
    subgraph sgOutput [" "]
      %% It works without this subgraph in this example. Not sure why.
      Output
    end
    subgraph sgInput [" "]
      Input
    end

  style Process fill: white, stroke: black
  classDef classHide fill: white, stroke: white
  class sgOutput,sgInput class1
flowchart LR
    Input --> Process
    Process --> Output
    Output --> Input

    subgraph Process
      A --> B --> C --> A
    end
    subgraph sgOutput [" "]
      %% It works without this subgraph in this example. Not sure why.
      Output
    end
    subgraph sgInput [" "]
      Input
    end

  style Process fill: white, stroke: black
  classDef class1 fill: white, stroke: white
  class sgOutput,sgInput class1

@Delfana
Copy link

Delfana commented Jan 12, 2023

Here's an ugly fix for #815 (comment).

First I have these nodes in order:

flowchart LR
subgraph foo
    foo1
    foo2
    foo3
end

Now I'd like to add an arrow from foo3 back to foo1, without changing the position of any nodes. But when I add an edge, the nodes move around:

flowchart LR
subgraph foo
    foo1
    foo2
    foo3 --> foo1
end

How would I apply the subgraph workaround in this situation? I've tried subgraphs around lots of different groups of nodes, but nothing seems to allow me to make the nodes line up in their original order.

I used the w/o in #815 (comment) and added invisible connections between all the nodes to keep them in the correct order. I wasn't able to get them on a crisp line though.
The direction needs to be defined in the subgraph. It doesn't matter what the direction in the main graph is set to in this example.

flowchart 

subgraph foo
    direction LR
    foo1 ---
    foo2 ---
    foo3 ---> foo1
end

linkStyle 0 stroke-width:0px
linkStyle 1 stroke-width:0px
flowchart 

subgraph foo
    direction LR
    foo1 ---
    foo2 ---
    foo3 ---> foo1
end

linkStyle 0 stroke-width:0px
linkStyle 1 stroke-width:0px

@felixsanz
Copy link

Why is this closed?

@bewuethr
Copy link

bewuethr commented Mar 7, 2023

Invisible links (A ~~~ B) were added in #4113, but they don't seem to be enabled for GitHub yet and they're available in GitHub, too:

flowchart LR
    A ~~~ B

@sidharthv96
Copy link
Member

info

Github is on v9.3.0. So I guess it'll be a while till it's released.

@Philzen
Copy link

Philzen commented Sep 13, 2023

This is a real issue for the determinism that seems to apply only to the default renderer.

When creating a flowchart with Yes/No decisions, i am used to (a least for simple ones) keep their placement consistent throughout the diagram, so the reader will know i.e. left = No and right = Yes.

I just yesterday – while meditating over the best implementation of a CI script – created a diagram with mermaid that i was very very pleased with in terms of consistent ordering: In the left example below all "No" decision outcomes are on the left, all "Yes" are on the right 😄. However, today i realized i could simplify it by removing a decision, thus making it easier to read and implement. If was very very sad to find that now the ordering is mixed up 😢 – although you can see from the code that the order of Outputs (Yes/No) is consistent in the mermaid code.

Original Simplified
flowchart TB
    A(("Gitlab runner\nstarting\n (Java + Maven\nproject)")) --> B
    
    B{<code>.sdkmanrc</code> ?}
    B -->|No| X
    B -->|Yes| Local

    Local{Local Java &<br>Maven present?} 
    Local -->|No| G
    Local -->|Yes| F
    
    F{Versions match<br><code>.sdkmanrc</code>?}
    F -->|No| Sdkman
    F -->|Yes| X

    Sdkman{sdkman\npresent?} 
    Sdkman -->|No| Install
    Sdkman -->|Yes| G

    Install[Install\nsdkman] --> G

    G[Run <code>sdk env</code>] --> X

    X((Execute Job))

flowchart TB
   A(("Gitlab runner\nstarting\n (Java + Maven\nproject)")) --> B
   
   B{<code>.sdkmanrc</code> ?}
   B -->|No| X
   B -->|Yes| LocalMatch

   LocalMatch{Required Java &<br>Maven versions<br>present?} 
   LocalMatch -->|No| Sdkman
   LocalMatch -->|Yes| X
   
   Sdkman{sdkman\npresent?} 
   Sdkman -->|No| Install
   Sdkman -->|Yes| G

   Install[Install\nsdkman] --> G

   G[Run <code>sdk env</code>] --> X

   X((Execute Job))
flowchart TB
    A(("Gitlab runner
    starting\n (Java + Maven
    project)")) --> B
    
    B{<code>.sdkmanrc</code> ?}
    B -->|No| X
    B -->|Yes| Local

    Local{Local Java &<br>Maven present?} 
    Local -->|No| G
    Local -->|Yes| F
    
    F{"Versions match
    <code>.sdkmanrc"</code>?}
    F -->|No| Sdkman
    F -->|Yes| X

    Sdkman{sdkman\npresent?} 
    Sdkman -->|No| Install
    Sdkman -->|Yes| G

    Install[Install\nsdkman] --> G

    G[Run <code>sdk env</code>] --> X

    X((Execute Job))
flowchart TB
    A(("Gitlab runner
    starting (Java + Maven
    project)")) --> B
    
    B{<code>.sdkmanrc</code> ?}
    B -->|No| X
    B -->|Yes| LocalMatch

    LocalMatch{"Required Java &
    Maven versions
    present?"} 
    LocalMatch -->|No| Sdkman
    LocalMatch -->|Yes| X
    
    Sdkman{sdkman\npresent?} 
    Sdkman -->|No| Install
    Sdkman -->|Yes| G

    Install[Install\nsdkman] --> G

    G[Run <code>sdk env</code>] --> X

    X((Execute Job))

Switching to the elk renderer fixes it, although it has a very different way of rendering the lines (straight instead of curved). It consistently respects the ordering of Yes and No outputs – changing which comes first also changes where they connect.

The following is how elk renders the simplified version above (only difference code-wise is that this starts with flowchart-elk):

flowchart-elk
    A(("Gitlab runner
    starting (Java + Maven
    project)")) --> B
    
    B{<code>.sdkmanrc</code> ?}
    B -->|No| X
    B -->|Yes| LocalMatch

    LocalMatch{"Required Java &
    Maven versions
    present?"} 
    LocalMatch -->|No| Sdkman
    LocalMatch -->|Yes| X
    
    Sdkman{sdkman\npresent?} 
    Sdkman -->|No| Install
    Sdkman -->|Yes| G

    Install[Install\nsdkman] --> G

    G[Run <code>sdk env</code>] --> X

    X((Execute Job))

@aScHEABL
Copy link

aScHEABL commented Jan 8, 2024

Hi! Sorry for the slow response.

The posisitioning of the nodes are done by a layout algorithm and sometimes that one is not perfect and worksarounds like the one is required. I am aware of this but is not easy to fix. I have half an idea of adding more layout algorithms and the possibility to pick the one thats best fits a particular use case.

The project has got good traction but it also means that it is very hard to manage all issues on your spare time. I am trying to get a bigger team together for faster development and better support #866. I am closing this one for now, not out of disrespect but as a part of an effort to clean out stale issues that has been resolved but not closed.

Is this still a problem? If so please reopen it.

Why did you close this issue when it's not resolved? The solutions provided above is still broken and not inconvenient at all.
And need a better documentation.
Guys, this issue has came to the existence for 4 YEARS. How and why is this still not fixed?

@ferrieux
Copy link

ferrieux commented Jan 8, 2024

I'm aware this issue is closed, and that #866 rightfully calls for help on a project that went unexpectedly big :)

However, there's one thing about development effort that is specific to the current issue (layout algorithms):
Instead of trying to create yet another algorithm that "does the right thing in all cases" (which might well be impossible), a lower-hanging fruit would be to document the existing ones so that users can predict the layout, and invent workarounds themselves. In some cases, it might even be smarter to simplify the algorithm, so that it becomes "less smart" and does fewer things "automagically", but also becomes more predictable, and lets the users (who typically are programmers) program it to do what they want, instead of the current practice of "fighting a whimsical blackbox".

To sum up: lowering the ambition and documenting, might be the cheapest in terms of manpower.

Sign up for free to join this conversation on GitHub. Already have an account? Sign in to comment
Labels
Graph: Flow Status: Approved Is ready to be worked on
Projects
None yet
Development

No branches or pull requests