-
Notifications
You must be signed in to change notification settings - Fork 609
New issue
Have a question about this project? Sign up for a free GitHub account to open an issue and contact its maintainers and the community.
By clicking “Sign up for GitHub”, you agree to our terms of service and privacy statement. We’ll occasionally send you account related emails.
Already on GitHub? Sign in to your account
difference in size between saved plot and fig #600
Comments
|
I assume when using a buffer you are saving it somehow? Can you show your code? If you show all your code, with some data, I can play with it and see what I can do. If I recall, when you ask matplotlib to savefig (as png or jpg, etc) it is using somewhat different code to render the image, so it is not guaranteed to look exactly the same; but there may be some work-arounds. |
|
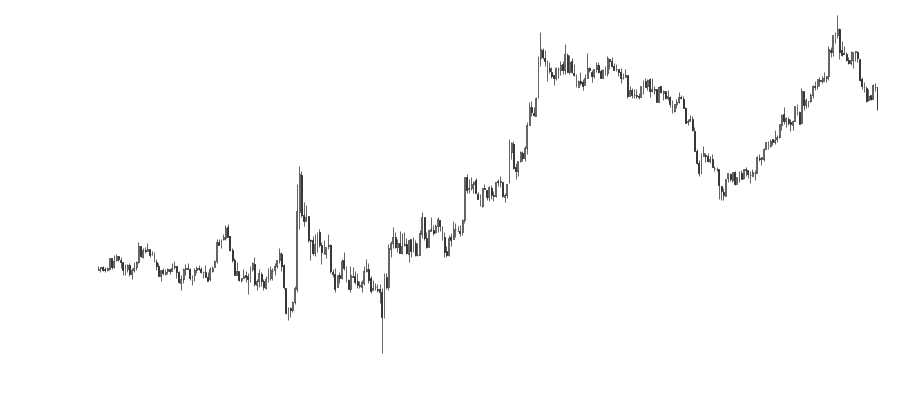
Hi Daniel, thanks for the quick response. this code returns fig of size (400, 900)and converts to numpy array X. This is the goal. Code below does the same but through saving and loading This time the size of the figure is (365, 801). Data is simple OHLC price. |
|
I'll try to take a look next week. |


I do not understand why plots differ in terms of size and how they look when I try to save them or returnfig.
I generate plots of figsize (9,4) when I save them they look great, with a tight layout, no margins and axes excellent! But I need these plots again so it would be better to use a buffer instead. However, when I use the buffer resulting plot has a different size and added margins on one side.
The saved plot has size (365, 801, 1) while plot from the buffer (400, 900, 1).
I appreciate any suggestions how to use buffer but without adding margins.
Thank you
The text was updated successfully, but these errors were encountered: