Regression in lossy nonphotographic images #3530
Comments
|
Follow Up: Artwork: git-master Photograph: git master Compilation of all results so far:
Photo:
Conclusion For the photo it's a similar story. 0.8.2 scores higher Butterguli metrics across all quality ranges. Oddly enough, for high quality tests 0.8.2 performs better under all metrics. For medium quality images, all metrics score in favor of 0.8.2 when compared to 0.10.2 and the git master branch. The exception is 0.9.2 where it keeps up with 0.8.2 in dssim/ssim2. Finally, low quality images is where things start to get interesting. Comparing 0.8.2 to 0.10.2/git master, all metrics point in favor of 0.8.2. However 0.9.2 beats 0.8.2 in every metric by a large margin! (except butteraguli) I wonder if the quality improvement is noticeable under the scrutiny of the human eye (it could be a fluke). Anyways, it doesn't really matter since the difference is close enough where there likely isn't a regression present here. To wrap it all up, the two different types of images shows us a possible regression in two different qualities. For lossy nonphotographic images, the regression seemed to me most apparent for low quality images around distances 2.5-3.0. For lossy photographic images, metrics favor higher qualities at distances 0.75-1.00 (probably just a fluke however). It seems like the git-master branch has improvements (#3531) (#3529) which bumps it up a notch over 0.10.2 but it still has a ways to go to match 0.8.2. Tweaking and refining of the next version is always happening, like (#3535) and more to come. Therefore the regression might slowly disappear over time. At the end of the day it's just algorithms and these results mean nothing when confronted with the human eye. Thanks for reading! Signing off, |
|
Thank you for doing this! I always make the quality-related decisions only by my eyes and more or less ignore the metrics. I'd know how to make the metrics much better but images to look worse. The process of eye-balling the quality may lead metrics to agree or disagree. I strongly emphasize on worst case behaviour and try to find mitigations for worst case rather than balanced performance -- since I anticipate that each worst case behaviour will cause practitioners to increase the quality settings and leading to broad increase in bytes for all content. Do you see -- with your own eyes -- degradation between 0.8 and 0.10, or any other ? |
|
Thanks for the input! I just use metrics as a sanity check to make sure I'm not just seeing things. If you want to focus on the worst case scenario, then lets look at images where .avif excels. For example the _ultraman image.
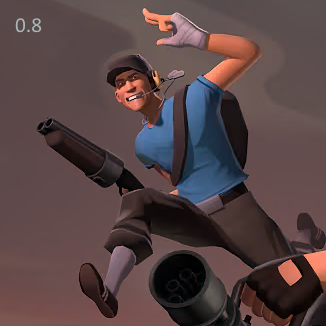
There is more noise in the cross hatching around the eye and forehead that shouldn't be there, so I think 0.8 looks better and more natural than 0.10. Zooming in, there is a weird grey area where there should be color, its very subtle but I realized that it was present in all images I compressed with 0.10. Obviously its much less visible in photos, but we are talking about the worst case scenario. I saw (#3520) and I tried it with the master branch (4da4b9a) but I got the same result. Here is another image illustrating similar regressions: tf2_wallpaper
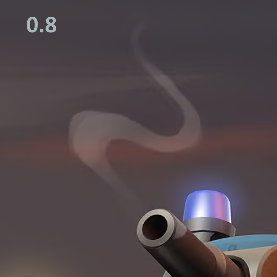
His face, cap, and gun all have noticeably more noise in 0.10. The strap covering his shirt is possibly the worst offender. There is more chroma noise around his neck. And the gun barrels underneath him are blurrier in 0.10.2. Same thing with the wrap around his hand, the lines are somewhat blurred out.
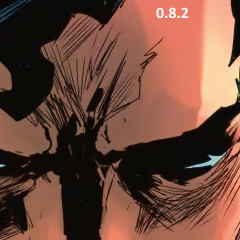
Here is where the smooth, low-contrast gradients get blurred and noise is added in 0.10. It's even more apparent when zoomed in. The photo I included in my benchmark shows that 0.10 is visually better that 0.8 in my opinion, despite the metrics favoring 0.8. And it clearly outperforms .avif since this is the kind of image jpegxl was tuned for The skin texture is sharper in the .avif but, there is a very clear banding/smoothing on shaded parts of the face, especially the cheeks. So jpegxl aims for total image consistency rather than focusing on points of interest (which is better imo). I understand that jpegxl is tuned for general use cases, but the additional noise/blurring leads to worse performance in nonphotographic images like the two examples I've shown. Where small changes to sharpness and smooth gradients are very noticeable. So if tuning the algorithms to benefit these kind of images hurts performance in other photos, then maybe something like, |
|
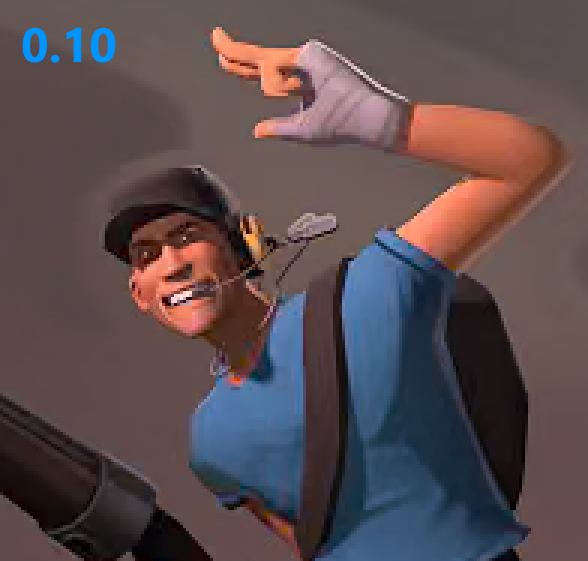
Just a quick follow-up: I’m comparing version 0.10.2 with the latest master version (commit 45e688c) to see how things have changed. I retested the images ultraman.png and tf2_wallpaper.png, both at a distance of 3. Here are the results:
It seems that a small amount of chroma banding is now gone. Additionally, the chroma noise issues have been resolved as well. Overall, it’s a significant improvement. While there is still some excessive blurring compared to version 0.8.2, the quality has definitely improved. |
Summary
In my limited testing, libjxl 0.8.2 outperforms libjxl 0.10.2 in nonphotographic images like artwork/screenshots. Similar behavior can be seen in photographic images but the gap in quality is smaller and could be with in margin of error.
Environment
Libjxl 0.10.2 and 0.8.2 are downloaded from the releases page
Identical behavior on Windows 10 and Ubuntu 22.04
Testing Methodology
Nonphotographic image: _ultraman
Photographic image: donald-michael-chambers-x2d-xcd55v-4
I libjxl 0.10.2 distances 0.75, 1.5, and 3 to represent high-medium-low quality benchmarks. These 0.10.2 images will be used as reference, I adjusted the distance setting in 0.8.2 to match the bbp of the reference images. Then I measured the subsequent outputs using four metrics, ssimulacra2, butteraugli, butteraugli (3-norm), and dssim. Since dssim does not allow .jxl input, I converted the images into a 16-bit png for the most quality and consistency.
I noticed that in benchmark_xl 0.8.2, ssimularcra2 and butteraugli gave different results for the same image when compared to those in the 0.10.2 library. For the sake of consistency, I have decided that tools provided in 0.10.2 are more accurate than those in 0.8.2, therefore I have replaced the ssimulacra2 and butteraugli numbers with the those provided in the latest release.
Side note: Since I'm replacing certain variables for 0.8.2 tables, the "Aggregate" row is not accurate, it shouldn't be necessary anyways since the difference is quite noticeable.
Nonphotographic image comparisons:
0.8.2
0.10.2
dssim metrics
Photographic image comparisons:
0.8.2
0.10.2
dssim metrics
Analysis/Conclusion
For artwork, it's clear to see that 0.8.2 has consistently scored higher in all tested metrics by significant amount. Libjxl 0.10.2 lags behind in quality and in speed for the same bbp. The speed regression is really strange since 0.10.2 should be much faster. I guess it slowed down for small and medium sized images. (should this is a separate issue?) On the other hand, the photo consistently scored higher in all metrics as well, but the gap is smaller, so its probably within margin of error. Most likely there is no regression for the photo. Also, here is where 0.10.2 outperforms 0.8.2 in terms of speed, maybe because it's a larger image?
PS: I also noticed that 0.9.2 gives similar subpar results compared to 0.8.2 but I didn't have the time to go into it with detail. So it seems that the regression happened in between 0.8.2 and 0.9.2. So more testing is needed regardless. Also, if somebody can provide me with a script that automates this process, that would make my life a lot easier.
The text was updated successfully, but these errors were encountered: