pcm-sensor-server is a collector exposing Intel processor metrics over http in JSON or Prometheus (exporter text based) format. Also available as a docker container.
Installation on target system to be analyzed:
- Build or download pcm tools
- As root, start pcm-sensor-server:
sudo ./pcm-sensor-serveror as non-root https://github.com/intel/pcm#executing-pcm-tools-under-non-root-user-on-linux
Alternatively one can start pcm-sensor-server as a container from docker hub.
Additional options:
$ ./pcm-sensor-server --help
Usage: ./pcm-sensor-server [OPTION]

Valid Options:
    -d                   : Run in the background
    -p portnumber        : Run on port <portnumber> (default port is 9738)
    -r|--reset           : Reset programming of the performance counters.
    -D|--debug level     : level = 0: no debug info, > 0 increase verbosity.
    -R|--real-time       : If possible the daemon will run with real time
                           priority, could be useful under heavy load to
                           stabilize the async counter fetching.
    -h|--help            : This information
The default output of pcm-sensor-server endpoint in a browser:

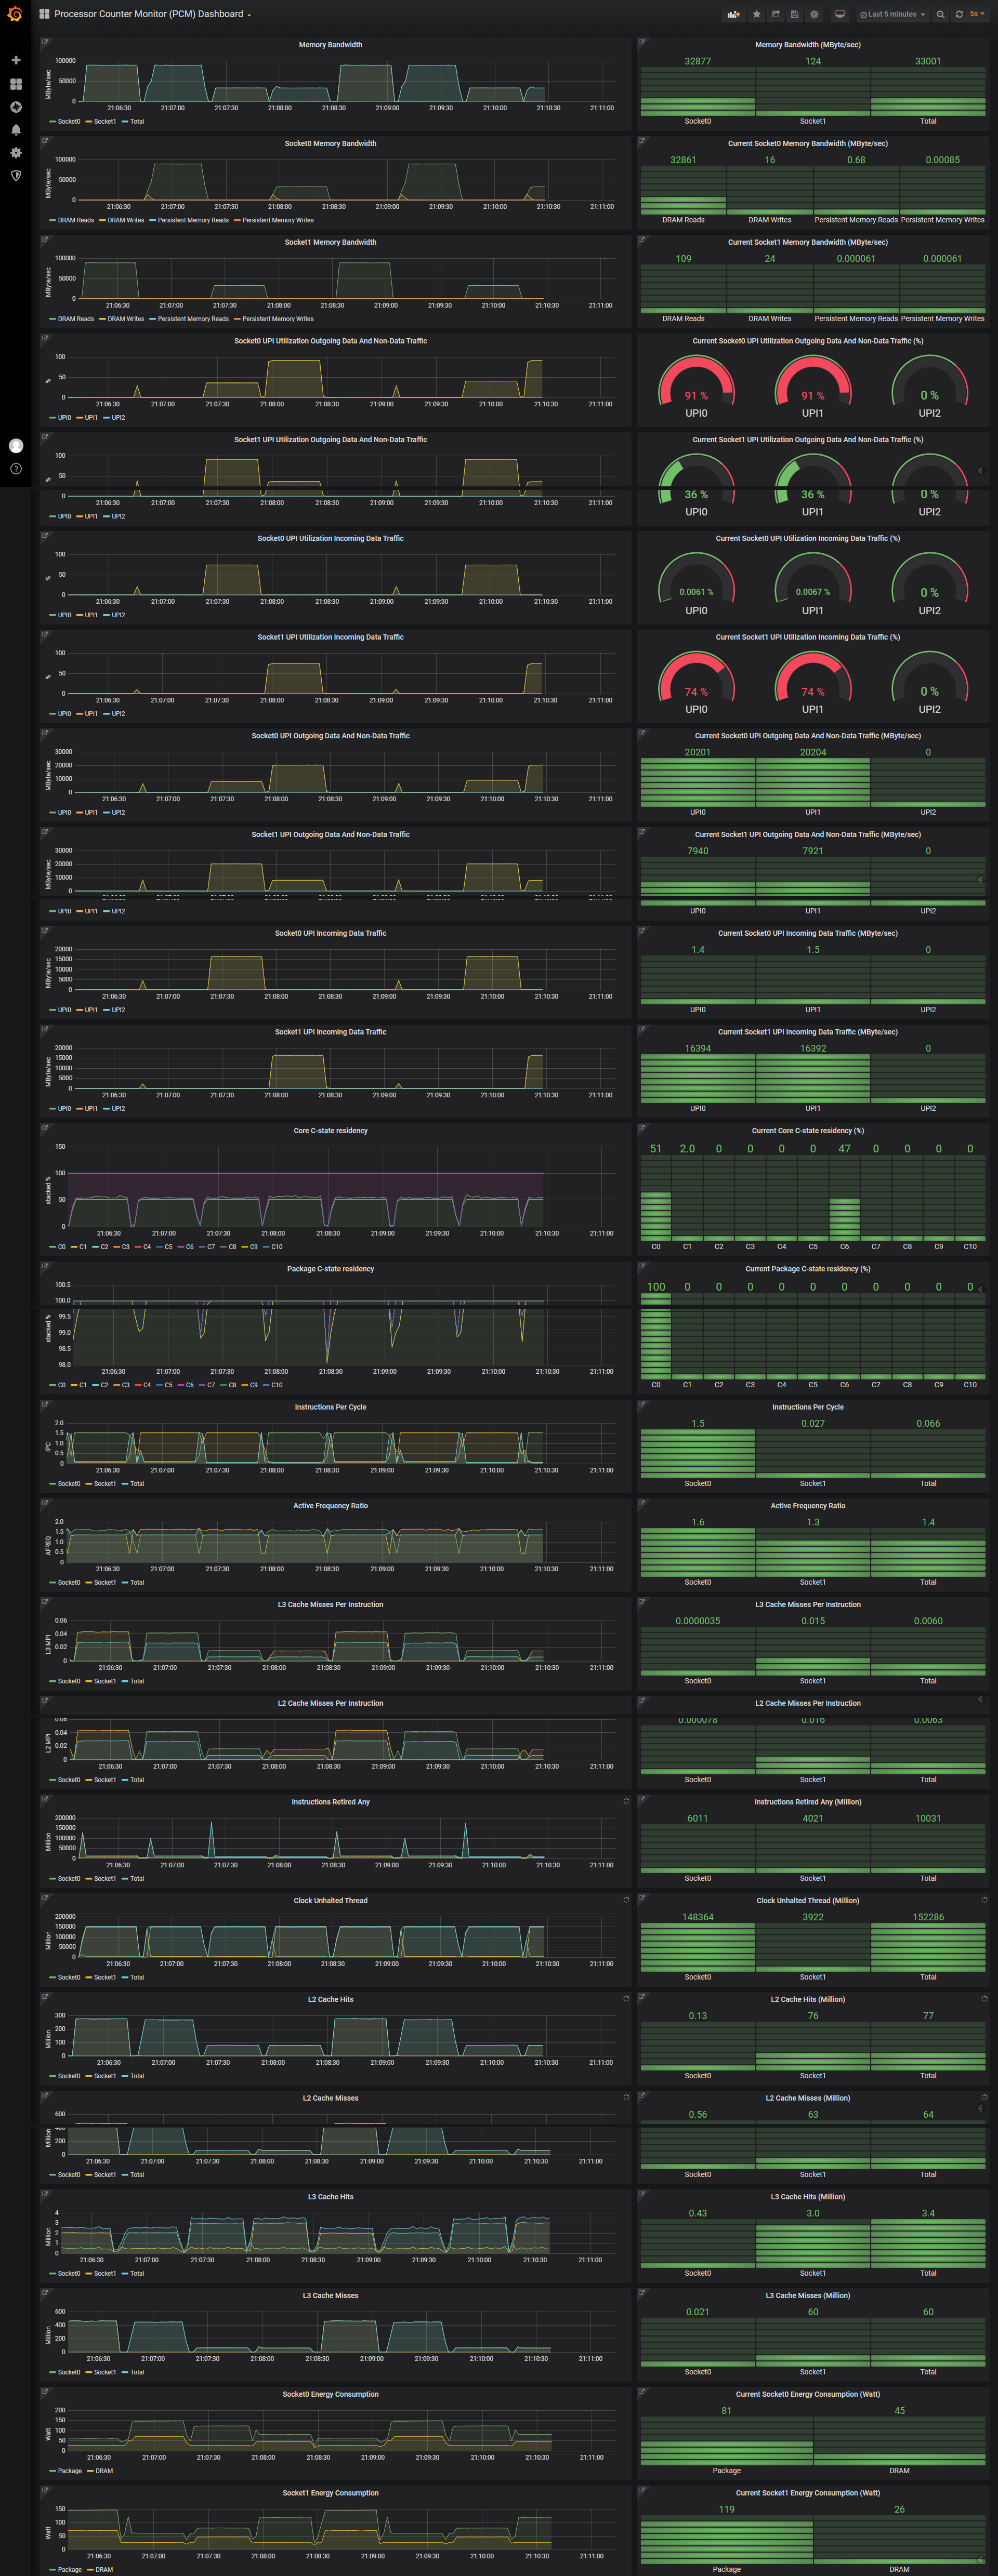
The PCM exporter can be used together with Grafana to obtain these Intel processor metrics (see how-to):