Replies: 30 comments
-
|
The main challenge with something like this is that it is necessarily glyph-specific and requires different work for different glyphs, or may not be applicable to many glyphs at all. This is unlike This specificity is not, in and of itself, "bad" . But it does make the task of figuring how to fit something in to the existing API somewhat harder. I.e. we can't just have a transform like @allefeld Do you have any concrete thoughts on how this might be "spelled" in the API? It would be really helpful if you could provide proposed code samples that you would like to be able to write. |
Beta Was this translation helpful? Give feedback.
-
|
I guess my offhand initial thought is that things like this might be better suited for higher level tools on top of Bokeh eg. Holoviews or Pandas-Bokeh or Chartify, because they operate at a better level of context to coordinate things like this. cc @bokeh/dev |
Beta Was this translation helpful? Give feedback.
-
|
I first posted an incomplete version, sorry, see completed version now. I agree, this only really makes sense for circle glyphs, and only for the combination of a quantitative axis ( I'm only getting into the Bokeh API right now, so I don't have a deep understanding and can't really comment, especially not on the JS side. How I could imagine it, on the Python side: It could be a method on |
Beta Was this translation helpful? Give feedback.
-
|
I agree with Bryan here. The amount of such tweaks is practically infinite and often only a handful of people needs a particular one of them. Bokeh already has everything a user needs to implement it by themselves via a custom |
Beta Was this translation helpful? Give feedback.
-
|
Something that might be more reasonable at the Bokeh level: A Python-only function that takes the concrete coordinates for a bunch of circles, and returns "splutzed coordinates" [1] def splutz(x, y, size):
''' Return a new set of non-colliding coordinates for markers, given an input set
of coordinates and size.
'''
x0 = [...]
y0 = [...]
x, y = splutz(x0, y0, 10)
# use the splutzed coordinates with circle
p.circle(x=x, y=y, size=10)I'd be OK with that. But it would have limitations to aware of, namely that his is a one-time, up-front operation. If it is necessary to accommodate dynamic, changing data (or sizes), then that would only be an option in Bokeh server apps were [1] need a name for this, obviously, but I am not sure what it would be |
Beta Was this translation helpful? Give feedback.
-
|
FWIW, I don't think it's worth it to introduce new things that alienate Bokeh and BokehJS even more. I think the effort would be better spent in creating a small and well documented library of such sub-classes that would also be used in the gallery, just to show what's possible. Another step would be to make the NPM dependency for such sub-classes optional when the JS code is written if a form that's usable as-is. Then it would be perfect, IMO. |
Beta Was this translation helpful? Give feedback.
-
I don't have especially strong feelings about this particular ask, but I will say in general that I think the best lens to view things through is that of "BokehJS is ground truth and everything else is merely a language binding". For any language (Python, R, Scala, whatever) there should be close parity at the models level. But I also think any language should absolutely build more idiomatic, convenience or sophisticated API on top of that as appropriate. We abandoned I'm generally sympathetic to the idea of offering convenience free-functions for purely data preparation when the data preparation is 1000x simpler to do in Pandas, e.g. These are just tools in an adjacent toolbox, to reach for if they happen to be useful, isolated back-box functions that are simple to test (because they have no interaction with models or BokehJS). What I am 👎 is new models that don't / can't play nice with existing patterns, adds to the existing web of model testing, or model-manipulating API that is easy to accidentally or unintentionally misuse. A good example of this is |
Beta Was this translation helpful? Give feedback.
-
|
I should also say: I think the proposal to better demonstrate |
Beta Was this translation helpful? Give feedback.
-
|
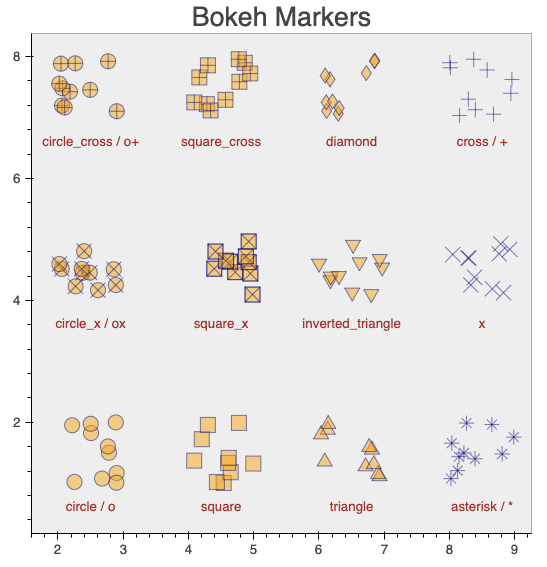
Sounds useful! I don't have much opinion about whether this functionality belongs in BokehJS, Bokeh Python, or outside of it, but would like to challenge the idea that it's restricted to circle glyphs. I'd say that instead it's only likely to be useful for statially compact glyphs, i.e. shapes for which a circular bounding region is a good approximation to the shape itself. For circles that criterion is trivially true, but I think it's also true for all of the typical markers in Bokeh:
If I fit a bounding circle to each of these and ensure there is no overlap between those bounding circles, I think that's a useful transformation regardless of marker shape, at least for the typical shapes of markers as above. With that in mind, even for circle glyphs one might want the bounding (keep-away) region not necessarily to be identical to the circle radius itself, to enforce a small whitespace border even between circles, at which point there's even less reason to distinguish between circles and other marker shapes. |
Beta Was this translation helpful? Give feedback.
-
|
@jbednar my example code above refers to markers in general :) |
Beta Was this translation helpful? Give feedback.
-
|
Thanks everybody for considering my proposal. I can see that you don't consider this a good fit for the core of Bokeh, and I understand.
Maybe I misunderstand, but the problem with that one-time approach is that the scales are needed. I can always preprocess the data I pass to Bokeh, but in order to achieve the effect of not-overlapping-but-touching I need both the scale ranges and the size of the plot box, and they are not available before the plot has been displayed.
Yes, I have done that in my Python example implementation. It's also true that this can be extended to every marker that is roughly spherical, not just circles, but I think the effect is less convincing. Regarding What would also be helpful would be more documentation of the architecture, how the different pieces fit together. https://docs.bokeh.org/en/latest/docs/reference/models.html goes into that direction, though it is very short. – But I realize that's a lot of work. Easier to realize would be improved navigation. For example, if I look at the Reference page for renderers, https://docs.bokeh.org/en/latest/docs/reference/models/renderers.html, it is quite long, and there is no in-page navigation. If I scroll down, I get lost in a long list of methods and properties, many of which repeat. Every class has Some ideas to improve that: |
Beta Was this translation helpful? Give feedback.
-
@allefeld I tend to agree with you but please know that other users have complained loudly (vociferously, even) in the past that it's not possibly a real reference guide, that it is worthless in fact, unless it includes absolutely every minute detail up to any point of repetition. So we no longer "factor out" base class properties or methods. I guess there is no possible pleasing everyone. The next release uses an updated Sphinx theme that affords a better right hand page navigation menu, though the reference guide may need some active editing to make the best use of it.
Just FYI these should really all be hidden/private but could not be made so, for uninteresting technical reasons. cc @tcmetzger re: docs ideas (separate issues should be branched off as appropriate) |
Beta Was this translation helpful? Give feedback.
-
|
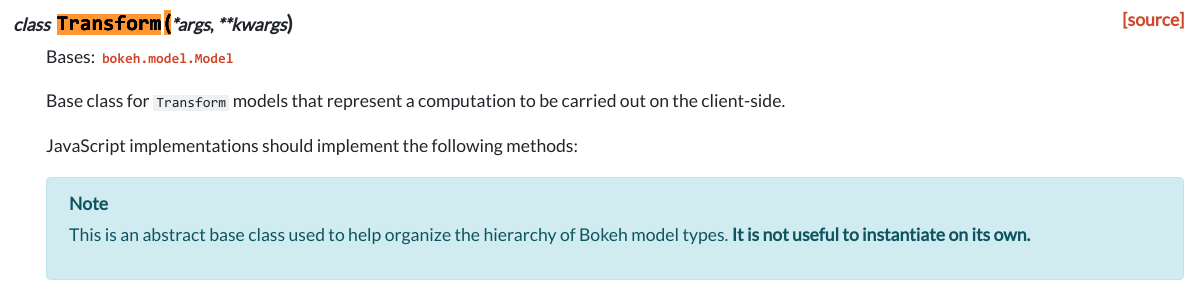
@allefeld Information about creating custom extensions (subclasses) is in the "Extending Bokeh" chapter of a the user's guide: https://docs.bokeh.org/en/latest/docs/user_guide/extensions.html I have to be frank and state that creating custom extensions is an advanced topic to begin with, and I think even amount that, this would be on the more difficult end of the spectrum. To be honest, I don't actually see an especially clean path to this with an expression or transform. The cleanest, most isolated way to implement this would probably be a new scatter marker type. In the past with ~20 individual marker models that would have been a nightmare. But now that all markers are really just one |
Beta Was this translation helpful? Give feedback.
-
|
@bryevdv, it goes without saying, but maybe should be said anyway, that this criticism doesn't take away from the amazing work you guys have done, and compared to many other complex projects, your documentation is extensive. Would it be helpful if I create another issue for the documentation-related proposals? I like the idea of a |
Beta Was this translation helpful? Give feedback.
-
|
@allefeld please don't read too much into my previous comment :) I think your docs ideas are good, but yes, for better task management I think they ought to go into dedicated issues. |
Beta Was this translation helpful? Give feedback.
-
|
@p-himik do you have any comments about adding a new specialized scatter marker? BTW I also wanted to mention another motivating case for my position above: contour plots. I would very, very much like it to be possible to create real contour plots with Bokeh. But this will always only be a "python side data prep" kind of thing, because of the extensive code and compute required. But even though it is "technically possible" now for anyone to create contour plots using |
Beta Was this translation helpful? Give feedback.
-
|
I am very predisposed against piling up features. Features are endless. And Bokeh has a scope. Things in this area aren't invented that fast - how often do you see a new plot type being created, or a new web standard being widely accepted that would be greatly beneficial for Bokeh? As far as I can tell, Bokeh gives everything someone needs to create such a marker themselves. I haven't checked in ages, but perhaps the documentation in that department can be improved, but that's about it. Creating a new marker is a trivial task. The counter-argument to that might be that there are Bokeh users that don't know JS and that would still like to have a custom marker or any other piece of functionality that requires custom JS code. To that I can only offer using support forums or hiring someone with enough skill to do it or to figure out how to do it. And if someone creates such a marker/expression/transform/whatever, and publishes it with a nice permissive license, and tests it, and shows that there's at least some interest from users other than the maintainer itself - only then I would considered adding such an extension to the core library. |
Beta Was this translation helpful? Give feedback.
-
|
On contour plots - I would add this feature to the core library. Only because contour plots have been around virtually forever and are still actively used. Whereas this particular feature request is just three days old. And I don't recall seeing such plots all that often (I might be completely wrong, but then someone needs to show it). But before adding contour plots, I would make sure that I've completely exhausted all viable possibilities of making most of the stuff happen on the BokehJS side. As an example, if I'm not mistaken, a similar argument has been made about |
Beta Was this translation helpful? Give feedback.
-
This is one variation of a dot plot, and this kind dodging is described explicitly in The Grammar of Graphics (1999) and probably earlier. I've definitely encountered this sort of plot in more statistically-inclined settings over the years with some regularity (e.g. it's built into ggpot
I am also similarly predisposed, by-and-large, trust me :) But I am also not opposed to applying experience and judgment to ascertain the amount of risk and effort involved and input those factors in the the calculus as well. In this case, for instance, all changes would be isolated to a new code in single new class that does not need to interact with anything else or (most importantly) require changes elsewhere. That observation goes a good distance for me in this specific case.
That is very specifically the argument, and I would claim that if the burden is "users have to write custom JS extensions" then 99% of the time that means Bokeh just won't get used. But also getting back to scope: the scope of Bokeh includes explicitly affording browser plotting to Python folks without having to know JS (at least to rough order).
I'd love for you to elaborate on this (in a new separate issue). AFAIK the "issue" with Regarding contours, we are already looking at optional C or C++ packages to support it. The best I could imagine doing in JS is implementing a Marching Squares implementation. But it would probably be too slow, and worse, Marching Squares is a purely local algo that generates a pile of disconnected segments rather then actual iso-lines that could drive |
Beta Was this translation helpful? Give feedback.
-
Then I yield to your expertise. :)
Sure, that's a good thing. But it still results in extra code that maintainers need to support. Markers have been rewritten before. There more markers there are, the more time each such global change will require, the more there's a chance to introduce new bugs.
And that's perfectly fine! If there's a better tool for the job, it should be chosen instead of Bokeh.
If it involves a widely used feature that's somehow not yet in Bokeh then I agree, because the situation is exactly the same as I've described above with the contour plots.
When and if I'm involved with that code again that uses |
Beta Was this translation helpful? Give feedback.
-
|
The question whether this has a place in Bokeh is obviously up to you guys. But, rejecting it because you "don't recall seeing such plots all that often" is a bad argument. People necessarily stick to what plotting packages offer them, however good or bad that is. Random jitter is much easier to implement, therefore it's everywhere – I'd say it's a poor man's dodging. Both are intended to solve the problem of overplotting, but jitter doesn't do it properly. By contrast, while contour plots in Bokeh would be nice, I don't think it's that important. One can use |
Beta Was this translation helpful? Give feedback.
-
Of course, that's why I'm not rejecting it and keeping on discussing it. |
Beta Was this translation helpful? Give feedback.
-
Sure, you can get contour lines like that, but often what people are after for contour plots are labeled contour lines (holoviz/holoviews#4494, https://gitter.im/pyviz/pyviz?at=605cdd99563232374c43874e), which do require JS-level support or some serious hacking. |
Beta Was this translation helpful? Give feedback.
-
I am afraid it is not quite so simple:
Regarding:
I mean, it sort of is. There is always more work than people to do it, which mean prioritization is impossible to avoid. A reasonable prioritization that many projects employ is "what will have the most impact per effort for users?" [1] In this case, I think it is reasonably common and impactful but was avoided until now because the existence of ~20 individual marker glyphs made the effort too high. Now that there is just one [1] devs are also human beings, so absent dedicated funding, "This is just something I would enjoy spending my limited personal free time on" is another perfectly valid criteria. |
Beta Was this translation helpful? Give feedback.
-
Of course. I was only protesting the suggestion that this is a weird thing that nobody ever uses. I think it would be appreciated by people with a stats background like myself. |
Beta Was this translation helpful? Give feedback.
-
|
I've updated the title to reflect the recent thoughts. I'm leaning towards marking as
Can one glyph cover both these cases? (I think so, but what are any specific considerations?) Second: what is the actual API / set of properties that a dodged scatter has? e.g. I have to presume there are at least a few tunable parameters to control how the dodging is done, what are these? What does proposed usage look like @allefeld This is where you can help greatly by working up a proposal for the code you would like to be able to write. |
Beta Was this translation helpful? Give feedback.
-
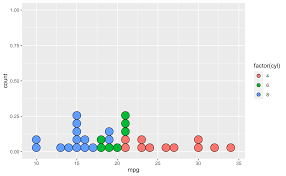
Range of applicabilityThe idea behind my proposal is that we have a scatter plot (to see the actual data, unlike a histogram or a KDE), but we want to avoid overplotting. If the data to be scatter-plotted consist of two numerical values (standard 2d scatter plot), then avoiding overplotting by dodging means one has to modify the data to be displayed, which goes contrary to seeing the actual data. (In that case I would rather go for the Datashader approach.) If one dimension is categorical, then adding offsets to the categorical data does not change the category. That's why I restricted my implementation to the case where there is one categorical scale and one numerical scale. (Actually, I restricted to linear scale, but there is no reason not to also allow logarithmic etc.) A possible extension of that approach that I see is to allow two categorical scales. In that case, the standard positions would be on the intersections of a 2d lattice, and dodging to avoid overplotting could be applied in both dimensions without changing category information, leading to clusters around the lattice intersections. I'm not sure how useful that would be, because there would be no information loss in just counting the number of data points per combination of categories; but I don't see anything wrong with it either. The GoG plotI don't think the plot from GoG is a dodged scatter plot, though it looks similar, because the vertical axis is labeled 'count' (though the tick labels are not counts?). This means that this plot is actually a variant of a histogram, with the difference that stacks of dots are used instead of the usual bars. The advantage could be that the discrete nature of counts is visually apparent, I like the plot for that. In this interpretation, there is no dodging involved. The displayed data is a list of tuples Of course the same effect could be achieved with a dodged scatter plot, by feeding in only the mpg values in multiples, e.g. |
Beta Was this translation helpful? Give feedback.
-
Tunable parametersI assume that we're modeling on the
This is what
To make it more user-friendly, If we allow two categorical axes, I'm not sure anything other than
For a circle marker, where the If as @jbednar proposed other markers are allowed, then it needs to be clear that for them If we allow markers of different sizes, then the minimum distance becomes |
Beta Was this translation helpful? Give feedback.
-
AlgorithmMy implementation positions (dodges) markers in the sequence they appear in the data. It is based on a search over predefined possible dodge values (in pixels): Here For each new marker to be positioned, it calculates the squared distance between already positioned markers and the possible offsets for the new one, and then the minimum across already positioned points: Due to some surrounding logic, at this point the dimension along which dodging is applied is x and the numerical data dimension is y. The admissible x-coordinates are those for which The optimal choice is the first entry in the resulting array: The same logic could be used for the A problem occurs if there are so many markers that at some point there are no admissible offsets anymore, i.e. Limitations1) My implementation uses a pre-defined array of possible offsets 2) My implementation positions markers one-by-one in the sequence of the data. This can lead to strange artifacts. For example, if the data are sorted and many differences between subsequent values are lower than the marker size, this leads to 'tendrils':
Better would certainly be a global optimization approach, but that would be very costly. I have some ideas on how to improve this using cheaper tricks, if you are interested. On the other hand, the tendrils as an indication of being-sorted could also be seen as a feature. |
Beta Was this translation helpful? Give feedback.
-
|
Going to move this to a GitHub discussion for further discussion and a new issue can be opened if/when we reach agreement on a concrete implementation/proposal |
Beta Was this translation helpful? Give feedback.
-
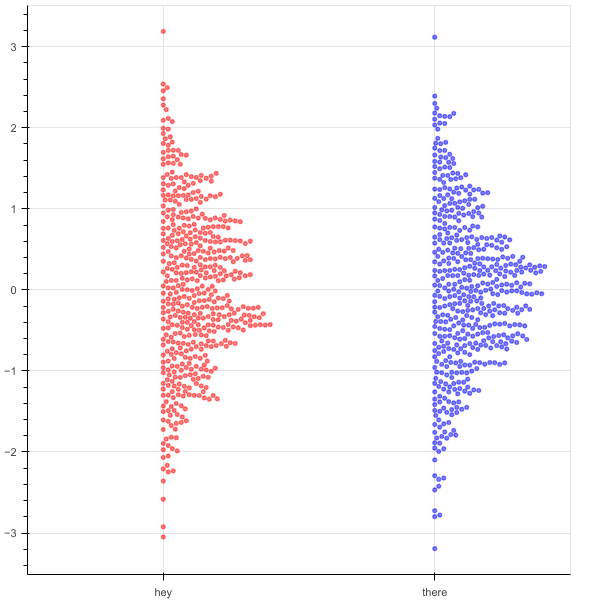
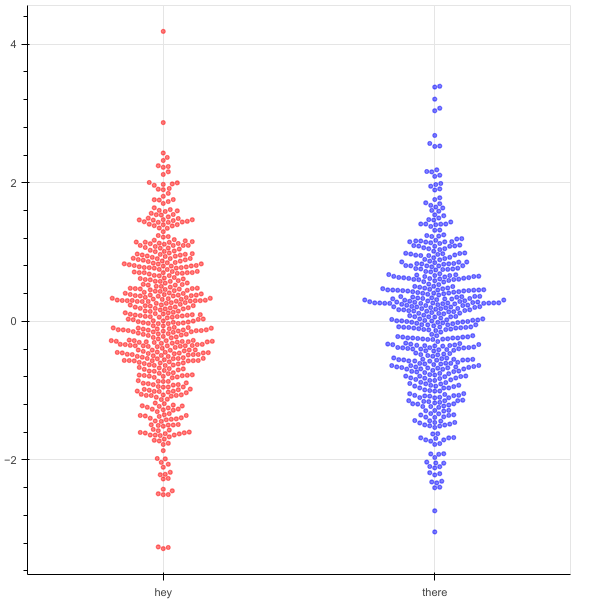
I propose to have a function, similar to to the
jittertransform, which moves circle glyphs in a one-dimensional scatter plot so that they do not overlap.Example:

It is similar to a jitter insofar as it is meant to avoid overlap, but not randomly, but by placing circles exactly such that they almost touch each other.
I created this example image via an implementation in Python. The function
circlestack(plot, renderer)takes both the plot and the circleGlyphRendereras arguments, and adjusts the offset in the('level', offset)representation of categorical values in the data source.I'm not sure it is 100% correct, but works decently well. However, it is more of a hack, and I think it would be great if something like this could be included in the JS side of Bokeh itself.
Beta Was this translation helpful? Give feedback.
All reactions