-verbose:gc
-XX:+PrintGC
-XX:+PrintGCDetails
-XX:+PrintGCDateStamps
-Xloggc:/opt/logs/gc.log
在JDK 8中, -verbose:gc是 -XX:+PrintGC一个别称,日志格式等价与: -XX:+PrintGC。 不过在JDK 9中 -XX:+PrintGC被标记deprecated。
-verbose:gc:是一个标准的选项,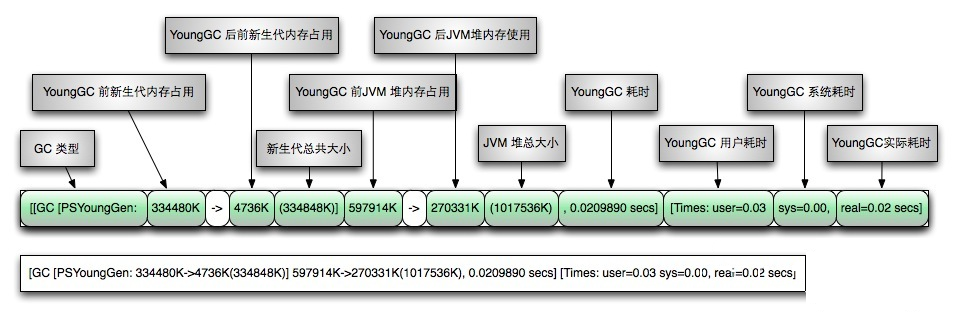
-XX:+PrintGC:是一个实验的选项,建议使用`-verbose:gc`替代`-XX:+PrintGC1) -XX:+PrintGC 参数 -XX:+PrintGC(或者 -verbose:gc)开启了简单GC日志模式,为每一次新生代(young generation)的GC和每一次的Full GC打印一行信息。 下面举例说明:
[GC 246656K->243120K(376320K), 0.0929090 secs]
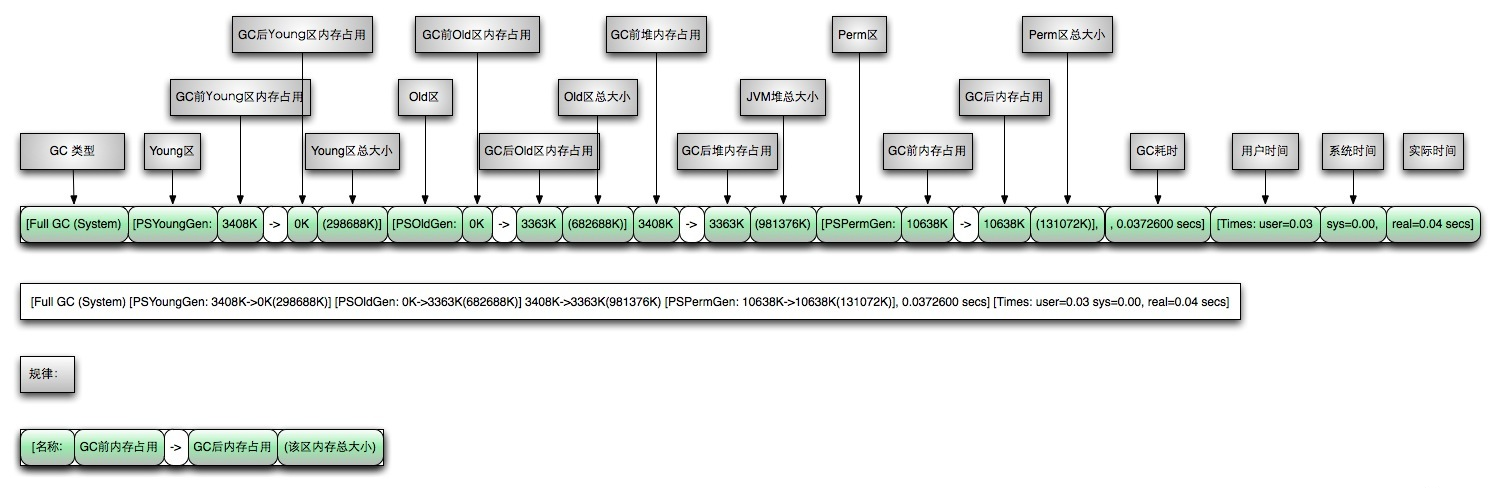
[Full GC 243120K->241951K(629760K), 1.5589690 secs]
2) -XX:+PrintGCDetails 开启了详细GC日志模式。在这种模式下,日志格式和所使用的GC算法有关。
3) -XX:+PrintGCTimeStamps和-XX:+PrintGCDateStamps 使用 -XX:+PrintGCTimeStamps 可以将时间和日期也加到GC日志中。表示自JVM启动至今的时间 戳会被添加到每一行中。 例子如下:
0.185: [GC 66048K->53077K(251392K), 0.0977580 secs]
0.323: [GC 119125K->114661K(317440K), 0.1448850 secs]
0.603: [GC 246757K->243133K(375296K), 0.2860800 secs]
如果指定了 -XX:+PrintGCDateStamps,每一行就添加上了绝对的日期和时间。
2014-01-03T12:08:38.102-0100: [GC 66048K->53077K(251392K), 0.0959470
secs]
2014-01-03T12:08:38.239-0100: [GC 119125K->114661K(317440K), 0.1421720
secs]
2014-01-03T12:08:38.513-0100: [GC 246757K->243133K(375296K), 0.2761000
secs]
如果需要也可以同时使用两个参数。推荐同时使用这两个参数,因为这样在关联不同来源的GC日志时很有帮助。
4) -Xloggc 缺省的GC日志时输出到终端的, 使用-Xloggc:也可以输出到指定的文件。需要注意这个参数隐式的设置了参数 -XX:+PrintGC和 -XX:+PrintGCTimeStamps ,但为了以防在新版本的JVM中有任何变化,我仍建议显示的设置这些参数。
cms垃圾回收:
Java HotSpot(TM) 64-Bit Server VM (25.161-b12) for linux-amd64 JRE (1.8.0_161-b12), built on Dec 19 2017 16:12:43 by "java_re" with gcc 4.3.0 20080428 (Red Hat 4.3.0-8)
Memory: 4k page, physical 24522532k(13970636k free), swap 25165820k(25107560k free)

CommandLine flags: -XX:+CMSClassUnloadingEnabled -XX:CMSFullGCsBeforeCompaction=0 -XX:CMSInitiatingOccupancyFraction=70 -
XX:+CMSParallelRemarkEnabled -XX:InitialHeapSize=12884901888 -
XX:+ManagementServer -XX:MaxHeapSize=12884901888 -XX:MaxNewSize=4831838208 -XX:MaxTenuringThreshold=15 -XX:NewSize=4831838208 -XX:OldPLABSize=16 -XX:ParallelGCThreads=16 -XX:+PrintClassHistogram -XX:+PrintGC -
XX:+PrintGCDetails -XX:+PrintGCTimeStamps -XX:SoftRefLRUPolicyMSPerMB=0 -XX:SurvivorRatio=8 -XX:ThreadStackSize=512 -XX:-TraceClassUnloading -
XX:+UseCMSCompactAtFullCollection -XX:+UseCompressedClassPointers -
XX:+UseCompressedOops -XX:+UseConcMarkSweepGC -XX:+UseParNewGC

2.797: [Full GC (System.gc()) 2.797: [CMS: 0K->26502K(7864320K), 0.1283532 secs] 1509991K->26502K(12111104K), [Metaspace: 16421K->16421K(1064960K)], 0.1318161 secs] [Times: user=0.21 sys=0.03, real=0.13 secs]
10.927: [GC (CMS Initial Mark) [1 CMS-initial-mark: 26502K(7864320K)] 2826906K(12111104K), 0.1008474 secs] [Times: user=0.78 sys=0.02, real=0.10 secs]
11.028: [CMS-concurrent-mark-start]
11.052: [CMS-concurrent-mark: 0.024/0.024 secs] [Times: user=0.17 sys=0.04, real=0.03 secs]
11.052: [CMS-concurrent-preclean-start]
11.091: [CMS-concurrent-preclean: 0.038/0.039 secs] [Times: user=0.18 sys=0.02, real=0.03 secs]
11.091: [CMS-concurrent-abortable-preclean-start]
 CMS: abort preclean due to time 16.192: [CMS-concurrent-abortable-
preclean: 1.216/5.101 secs] [Times: user=21.61 sys=0.44, real=5.11 secs]

16.192: [GC (CMS Final Remark) [YG occupancy: 3356366 K (4246784 K)]16.193: [Rescan (parallel) , 0.1116331 secs]16.304: [weak refs processing,
0.0004650 secs]16.305: [class unloading, 0.0205329 secs]16.325: [scrub symbol table, 0.0073514 secs]16.333: [scrub string table, 0.0012032 secs]
[1 CMS-remark: 26502K(7864320K)] 3382869K(12111104K), 0.1445932 secs] [Times: user=1.64 sys=0.02, real=0.14 secs]
16.337: [CMS-concurrent-sweep-start]
16.354: [CMS-concurrent-sweep: 0.016/0.016 secs] [Times: user=0.02
sys=0.00, real=0.02 secs]
16.354: [CMS-concurrent-reset-start]
16.394: [CMS-concurrent-reset: 0.040/0.040 secs] [Times: user=0.02
sys=0.03, real=0.04 secs]
19.647: [GC (Allocation Failure) 19.647: [ParNew: 3774976K->471807K(4246784K), 0.3042301 secs] 3792918K->587685K(12111104K),
0.3043870 secs] [Times: user=0.76 sys=0.85, real=0.30 secs]
25.275: [GC (Allocation Failure) 25.275: [ParNew: 4246783K->194499K(4246784K), 0.5530195 secs] 4362661K->659531K(12111104K),
0.5531499 secs] [Times: user=2.17 sys=0.31, real=0.55 secs]
30.986: [GC (Allocation Failure) 30.986: [ParNew: 3969475K->379153K(4246784K), 0.0874455 secs] 4434507K->844185K(12111104K),
0.0875569 secs] [Times: user=1.35 sys=0.01, real=0.09 secs]
36.502: [GC (Allocation Failure) 36.503: [ParNew: 4154129K->421214K(4246784K), 0.2554706 secs] 4619161K->1050402K(12111104K),
0.2555957 secs] [Times: user=2.50 sys=0.24, real=0.25 secs]
42.356: [GC (Allocation Failure) 42.356: [ParNew: 4196190K->376925K(4246784K), 0.2549377 secs] 4825378K->1156190K(12111104K),
0.2551341 secs] [Times: user=2.83 sys=0.09, real=0.25 secs]
50.611: [GC (CMS Initial Mark) [1 CMS-initial-mark: 779265K(7864320K)] 3364823K(12111104K), 0.1902959 secs] [Times: user=1.55 sys=0.00, real=0.19 secs]
50.801: [CMS-concurrent-mark-start]
51.245: [CMS-concurrent-mark: 0.416/0.444 secs] [Times: user=5.57 sys=0.05, real=0.45 secs]
51.246: [CMS-concurrent-preclean-start]
51.308: [CMS-concurrent-preclean: 0.057/0.062 secs] [Times: user=0.68 sys=0.02, real=0.06 secs]
51.308: [CMS-concurrent-abortable-preclean-start]
55.878: [GC (Allocation Failure) 55.878: [ParNew: 4151901K->401091K(4246784K), 0.3703185 secs] 4931166K->1334098K(12111104K),
0.3706154 secs] [Times: user=3.03 sys=0.07, real=0.37 secs]
 CMS: abort preclean due to time 56.728: [CMS-concurrent-abortable-
preclean: 4.699/5.419 secs] [Times: user=57.69 sys=1.36, real=5.42 secs] 56.729: [GC (CMS Final Remark) [YG occupancy: 1032905 K (4246784 K)]56.729: [Rescan (parallel) , 0.0607694 secs]56.790: [weak refs processing,
0.0004417 secs]56.790: [class unloading, 0.0532731 secs]56.844: [scrub symbol table, 0.0137044 secs]56.857: [scrub string table, 0.0022564 secs]
[1 CMS-remark: 933006K(7864320K)] 1965912K(12111104K), 0.1541694 secs] [Times: user=0.98 sys=0.00, real=0.16 secs]
56.884: [CMS-concurrent-sweep-start]
57.457: [CMS-concurrent-sweep: 0.548/0.573 secs] [Times: user=4.23sys=0.08, real=0.57 secs]
57.457: [CMS-concurrent-reset-start]
57.474: [CMS-concurrent-reset: 0.017/0.017 secs] [Times: user=0.09sys=0.00, real=0.02 secs]
63.127: [GC (Allocation Failure) 63.128: [ParNew: 4176067K->272024K(4246784K), 0.2231164 secs] 4720340K->949516K(12111104K),0.2234353 secs] [Times: user=1.84 sys=0.01, real=0.22 secs]

65.346: [GC (Allocation Failure) 65.347: [ParNew: 4047000K->146015K(4246784K), 0.0494929 secs] 4724492K->823507K(12111104K), 0.0505688 secs] [Times: user=0.53 sys=0.01, real=0.05 secs]
67.243: [GC (Allocation Failure) 67.243: [ParNew: 3920991K->151093K(4246784K), 0.0632491 secs] 4598483K->828584K(12111104K), 0.0635686 secs] [Times: user=0.72 sys=0.02, real=0.06 secs]
71.833: [GC (Allocation Failure) 71.833: [ParNew: 3926069K->152077K(4246784K), 0.0563183 secs] 4603560K->829569K(12111104K), 0.0566875 secs] [Times: user=0.51 sys=0.02, real=0.05 secs]
74.190: [GC (Allocation Failure) 74.190: [ParNew: 3927053K->155697K(4246784K), 0.0509473 secs] 4604545K->833189K(12111104K), 0.0512858 secs] [Times: user=0.52 sys=0.00, real=0.05 secs]
77.148: [GC (Allocation Failure) 77.148: [ParNew: 3930673K->172521K(4246784K), 0.0567456 secs] 4608165K->850012K(12111104K), 0.0570627 secs] [Times: user=0.51 sys=0.01, real=0.06 secs]
80.006: [GC (Allocation Failure) 80.008: [ParNew: 3947497K->187906K(4246784K), 0.0576664 secs] 4624988K->865398K(12111104K), 0.0604121 secs] [Times: user=0.58 sys=0.02, real=0.06 secs]
82.766: [GC (Allocation Failure) 82.767: [ParNew: 3962882K->215324K(4246784K), 0.0650993 secs] 4640374K->892816K(12111104K), 0.0654341 secs] [Times: user=0.59 sys=0.01, real=0.07 secs]
84.956: [GC (Allocation Failure) 84.956: [ParNew: 3990300K->189175K(4246784K), 0.0722586 secs] 4667792K->866667K(12111104K), 0.0726157 secs] [Times: user=0.68 sys=0.06, real=0.07 secs]
86.734: [GC (Allocation Failure) 86.735: [ParNew: 3964151K->225468K(4246784K), 0.0596107 secs] 4641643K->902960K(12111104K), 0.0599598 secs] [Times: user=0.62 sys=0.01, real=0.06 secs]
88.138: [GC (Allocation Failure) 88.138: [ParNew: 4000444K->238931K(4246784K), 0.0709075 secs] 4677936K->916423K(12111104K), 0.0714342 secs] [Times: user=0.75 sys=0.02, real=0.07 secs]
89.686: [GC (Allocation Failure) 89.686: [ParNew: 4013907K->215527K(4246784K), 0.0666623 secs] 4691399K->893019K(12111104K), 0.0670266 secs] [Times: user=0.71 sys=0.01, real=0.07 secs]
94.888: [GC (Allocation Failure) 94.888: [ParNew: 3990503K->250699K(4246784K), 0.0794478 secs] 4667995K->928191K(12111104K), 0.0798372 secs] [Times: user=0.68 sys=0.02, real=0.08 secs]
98.643: [GC (Allocation Failure) 98.643: [ParNew: 4025675K->251282K(4246784K), 0.0817729 secs] 4703167K->928774K(12111104K), 0.0821377 secs] [Times: user=0.70 sys=0.04, real=0.08 secs]
101.366: [GC (Allocation Failure) 101.367: [ParNew: 4026258K->197528K(4246784K), 0.1618516 secs] 4703750K->940477K(12111104K), 0.1623082 secs] [Times: user=1.52 sys=0.03, real=0.16 secs]
104.010: [GC (Allocation Failure) 104.010: [ParNew: 3972504K->145150K(4246784K), 0.0602960 secs] 4715453K->894191K(12111104K), 0.0606576 secs] [Times: user=0.58 sys=0.00, real=0.06 secs]
107.555: [GC (Allocation Failure) 107.555: [ParNew: 3920126K->168323K(4246784K), 0.0602142 secs] 4669167K->922176K(12111104K), 0.0606687 secs] [Times: user=0.54 sys=0.01, real=0.06 secs]
109.891: [GC (Allocation Failure) 109.891: [ParNew: 3943299K->150806K(4246784K), 0.0463666 secs] 4697152K->909307K(12111104K), 0.0467131 secs] [Times: user=0.52 sys=0.01, real=0.05 secs]
112.004: [GC (Allocation Failure) 112.004: [ParNew: 3925782K->142327K(4246784K), 0.0449720 secs] 4684283K->904433K(12111104K), 0.0453117 secs] [Times: user=0.52 sys=0.01, real=0.04 secs]
114.460: [GC (GCLocker Initiated GC) 114.460: [ParNew: 3917303K->179128K(4246784K), 0.0496533 secs] 4679409K->945121K(12111104K), 0.0500101 secs] [Times: user=0.53 sys=0.02, real=0.05 secs]

117.121: [GC (Allocation Failure) 117.121: [ParNew: 3954104K->189639K(4246784K), 0.0543951 secs] 4720097K->960508K(12111104K), 0.0547834 secs] [Times: user=0.58 sys=0.01, real=0.06 secs]
119.502: [GC (Allocation Failure) 119.502: [ParNew: 3964615K->188848K(4246784K), 0.0589422 secs] 4735484K->966983K(12111104K), 0.0592991 secs] [Times: user=0.62 sys=0.01, real=0.05 secs]
122.948: [GC (Allocation Failure) 122.948: [ParNew: 3963824K->186785K(4246784K), 0.0608141 secs] 4741959K->971625K(12111104K), 0.0612381 secs] [Times: user=0.64 sys=0.03, real=0.06 secs]
126.492: [GC (Allocation Failure) 126.492: [ParNew: 3961761K->167700K(4246784K), 0.0637857 secs] 4746601K->957040K(12111104K), 0.0641659 secs] [Times: user=0.62 sys=0.01, real=0.06 secs]
129.435: [GC (Allocation Failure) 129.435: [ParNew: 3942676K->200601K(4246784K), 0.0607756 secs] 4732016K->993947K(12111104K), 0.0611351 secs] [Times: user=0.61 sys=0.00, real=0.06 secs]
132.434: [GC (Allocation Failure) 132.434: [ParNew: 3975577K->197187K(4246784K), 0.0565574 secs] 4768923K->993657K(12111104K), 0.0569111 secs] [Times: user=0.64 sys=0.01, real=0.05 secs]
134.970: [GC (Allocation Failure) 134.970: [ParNew: 3972163K->202072K(4246784K), 0.0532381 secs] 4768633K->999399K(12111104K), 0.0536108 secs] [Times: user=0.56 sys=0.00, real=0.06 secs]
137.014: [GC (GCLocker Initiated GC) 137.014: [ParNew: 3977081K->176798K(4246784K), 0.0775254 secs] 4774409K->989775K(12111104K), 0.0778897 secs] [Times: user=0.69 sys=0.01, real=0.07 secs]
139.494: [GC (Allocation Failure) 139.494: [ParNew: 3951774K->174304K(4246784K), 0.0659993 secs] 4764751K->993307K(12111104K), 0.0663516 secs] [Times: user=0.63 sys=0.01, real=0.06 secs]
141.341: [GC (Allocation Failure) 141.341: [ParNew: 3949280K->153273K(4246784K), 0.0484796 secs] 4768283K->977967K(12111104K), 0.0494725 secs] [Times: user=0.55 sys=0.01, real=0.05 secs]
143.220: [GC (Allocation Failure) 143.220: [ParNew: 3928249K->178782K(4246784K), 0.0442161 secs] 4752943K->1006168K(12111104K), 0.0445422 secs] [Times: user=0.55 sys=0.00, real=0.05 secs]
145.352: [GC (Allocation Failure) 145.352: [ParNew: 3953758K->138060K(4246784K), 0.0544436 secs] 4781144K->974572K(12111104K), 0.0547979 secs] [Times: user=0.59 sys=0.02, real=0.05 secs]
147.367: [GC (Allocation Failure) 147.367: [ParNew: 3913036K->169955K(4246784K), 0.0532576 secs] 4749548K->1013139K(12111104K), 0.0536105 secs] [Times: user=0.60 sys=0.00, real=0.05 secs]
148.867: [GC (Allocation Failure) 148.867: [ParNew: 3944931K->165887K(4246784K), 0.0583501 secs] 4788115K->1014362K(12111104K), 0.0587259 secs] [Times: user=0.64 sys=0.02, real=0.06 secs]参考http://ifeve.com/jvm-cms-log/
在CMS GC 时,使用参数-XX:+PrintGCDetails 和 -XX:+PrintGCTimeStamps 会输出很多日志信息,了解这些信息可以帮我们更好的调整参数,以获得更高的性能。

我们来看下在JDK1.4.2_10 中CMS GC日志示例:

39.910: [GC 39.910: [ParNew: 261760K->0K(261952K), 0.2314667 secs] 262017K-
>26386K(1048384K), 0.2318679 secs]6

新生代使用 (ParNew 并行)回收器。新生代容量为261952K,GC回收后占用从261760K降到0,耗时0.2314667秒。(译注:262017K->26386K(1048384K), 0.2318679 secs 表示整个堆占用从262017K 降至26386K,费时0.2318679)

40.146: [GC [1 CMS-initial-mark: 26386K(786432K)] 26404K(1048384K),
0.0074495 secs]
开始使用CMS回收器进行老年代回收。初始标记(CMS-initial-mark)阶段,这个阶段标记由根可以直接到达的对象,标记期间整个应用线程会暂停。
老年代容量为786432K,CMS 回收器在空间占用达到 26386K 时被触发

40.154: [CMS-concurrent-mark-start]
开始并发标记(concurrent-mark-start) 阶段,在第一个阶段被暂停的线程重新开始运行,由前阶段标记过的对象出发,所有可到达的对象都在本阶段中标记。

40.683: [CMS-concurrent-mark: 0.521/0.529 secs]
并发标记阶段结束,占用 0.521秒CPU时间, 0.529秒墙钟时间(也包含线程让出CPU给其他线程执行的时间)

40.683: [CMS-concurrent-preclean-start]
开始预清理阶段
预清理也是一个并发执行的阶段。在本阶段,会查找前一阶段执行过程中,从新生代晋升或新分配或被更新的对象。通过并发地重新扫描这些对象,预清理阶段可以减少下一个stop-the-world 重新标记阶段的工作量。

40.701: [CMS-concurrent-preclean: 0.017/0.018 secs]
预清理阶段费时 0.017秒CPU时间,0.018秒墙钟时间。

40.704: [GC40.704: [Rescan (parallel) , 0.1790103 secs]40.883: [weak refsprocessing, 0.0100966 secs] [1 CMS-remark: 26386K(786432K)]
52644K(1048384K), 0.1897792 secs]
Stop-the-world 阶段,从根及被其引用对象开始,重新扫描 CMS 堆中残留的更新过的对象。这里重新扫描费时0.1790103秒,处理弱引用对象费时0.0100966秒,本阶段费时0.1897792 秒。

40.894: [CMS-concurrent-sweep-start]
开始并发清理阶段,在清理阶段,应用线程还在运行。

41.020: [CMS-concurrent-sweep: 0.126/0.126 secs]
并发清理阶段费时0.126秒

41.020: [CMS-concurrent-reset-start]
开始并发重置
41.147: [CMS-concurrent-reset: 0.127/0.127 secs]
在本阶段,重新初始化CMS内部数据结构,以备下一轮 GC 使用。本阶段费时0.127秒
这是CMS正常运行周期打印的日志,现在让我们一起看一下其他的CMS日志记录:

197.976: [GC 197.976: [ParNew: 260872K->260872K(261952K), 0.0000688
secs]197.976: [CMS197.981: [CMS-concurrent-sweep: 0.516/0.531 secs]
(concurrent mode failure): 402978K->248977K(786432K), 2.3728734 secs]
663850K->248977K(1048384K), 2.3733725 secs]
这段信息显示ParNew 收集器被请求进行新生代的回收,但收集器并没有尝试回收,因为 它 预计在最糟糕的情况下, CMS 老年代中没有足够的空间容纳新生代的幸存对象。我们把这个失败称之为”完全晋升担保失败”。
因为这样,并发模式的 CMS 被中断同并且在 197.981秒时,Full GC被启动。这次Full GC,采用标记-清除-整理算法,会发生stop-the-world,费时2.3733725秒。CMS 老年代占用从 402978K降到248977K。45

避免并发模式失败, 通过增加老年代空间大小或者设置参数 CMSInitiatingOccupancyFraction同时设置UseCMSInitiatingOccupancyOnly为true。参数
CMSInitiatingOccupancyFraction 的值必须谨慎选择,设置过低会造成频繁发生 CMS 回收。
有时我们发现,当日志中出现晋升失败时,老年代还有足够的空间。这是因为”碎片”,老年代中的可用空间并不连续,而从新生代晋升上来的对象,需要一块连续的可用空间。CMS 收集器是一种非压缩收集器,在某种类型的应用中会发生碎片。下面博客中 Jon 详细讨论了如何处理碎片问题:
https://blogs.oracle.com/jonthecollector/entry/when_the_sum_of_the
从JDK 1.5 开始,CMS 收集器中的晋升担保检查策略有些变化。原来的策略是考虑最坏情况,即新生代所有对象都晋升到老年代 , 新的晋升担保检查策略基于最近晋升历史情况,这种预计晋升对象比最坏情况下晋升对象要少很多,因此需要的空间也会少点。如果晋升失败,新生代处于一致状态。触发一次 stop-the-world 的标记-压缩收集. 如果想在 UseSerialGC 中获得这种功能,需要设置参数
-XX:+HandlePromotionFailure.

283.736: [Full GC 283.736: [ParNew: 261599K->261599K(261952K), 0.0000615secs] 826554K->826554K(1048384K), 0.0003259 secs]
GC locker: Trying a full collection because scavenge failed
283.736: [Full GC 283.736: [ParNew: 261599K->261599K(261952K), 0.0000288
secs]

当一个JNI 关键区被释放时会发生 Stop-the-world GC。新生代因为晋升担保失败回收失败,触发一次 Full GC.

CMS 可以运行在增量模式下(i-cms), 使用参数 -XX:+CMSIncrementalMode. 在增量模式下,
CMS 收集器在并发阶段,不会独占整个周期,而会周期性的暂停,唤醒应用线程。收集器把并发阶段工
作,划分为片段,安排在次级(minor) 回收之间运行。这对需要低延迟,运行在少量CPU服务器上的应
用很有用。

以下是增量模式 CMS的日志.
2803.125: [GC 2803.125: [ParNew: 408832K->0K(409216K), 0.5371950 secs]
611130K->206985K(1048192K) icms_dc=4 , 0.5373720 secs]
2824.209: [GC 2824.209: [ParNew: 408832K->0K(409216K), 0.6755540 secs]
615806K->211897K(1048192K) icms_dc=4 , 0.6757740 secs]

新生代花费 537 毫秒 和 675 毫秒. 在2次收集之间 iCMS 短暂运行期间由icms_dc 表示,icms_dc 表示运行的占空比。这里占空比为4% .
简单计算下, iCMS 增量阶段费时 4/100 * (2824.209 – 2803.125 – 0.537) = 821 毫秒, 即 2次 GC 间隔时间的 4% .

在JDK 1.5 中, CMS 增加一个并发可中止预清理(concurrent abortable preclean)阶段.
可中止预清理阶段,运行在并行预清理和重新标记之间,直到获得所期望的eden空间占用率。增加这个阶段是为了避免在重新标记阶段后紧跟着发生一次垃圾清除。为了尽可能区分开垃圾清除和重新标记 ,我们尽量安排在两次垃圾清除之间运行重新标记阶段。
There is a second reason why we do this. Immediately following a scavengethere are likely a large number of grey objects that need rescanning. Theabortable preclean phase tries to deal with such newly grey objects thusreducing a subsequent CMS remark pause.

可以通过JVM参数CMSScheduleRemarkEdenSizeThreshold 和CMSScheduleRemarkEdenPenetration 控制 重新标记阶段。默认值是2m和50%.CMSScheduleRemarkEdenSizeThreshold 设置Eden区大小,低于此值时不启动重新标记阶段,因为回报预期为微不足道 CMSScheduleRemarkEdenPenetration 设置启动重新标记阶段时Eden区的空间占用率。(译注:根据下面描述 Eden 应该是指整个新生代)

预清理阶段后,如果Eden 空间占用大于 CMSScheduleRemarkEdenSizeThreshold 设置的值,会启动可中止预清理,直到占用率达到 CMSScheduleRemarkEdenPenetration 设置的值, 否则,我们立即安排重新标记阶段.(译注:与上面说的正好相反,不知是不是我翻译有误)

7688.150: [CMS-concurrent-preclean-start]
7688.186: [CMS-concurrent-preclean: 0.034/0.035 secs]
7688.186: [CMS-concurrent-abortable-preclean-start]71

7688.465: [GC 7688.465: [ParNew: 1040940K->1464K(1044544K), 0.0165840 secs] 1343593K->304365K(2093120K), 0.0167509 secs] 7690.093: [CMS-concurrent-abortable-preclean: 1.012/1.907 secs] 7690.095: [GC[YG occupancy: 522484 K (1044544 K)]7690.095: [Rescan (parallel) , 0.3665541 secs]7690.462: [weak refs processing, 0.0003850 secs] [1 CMS-remark: 302901K(1048576K)] 825385K(2093120K), 0.3670690 secs]

上面日志中,在预清理之后, 启动可中止预清理, 之后发生年轻代垃圾回收,年轻代占用从 1040940K 下降到 1464K. 当年轻代占用率达到 522484K 即堆的50%时,发生重新标记

注意在JDK1.5中,年轻代的垃圾回收日志输出在后面的重新标记阶段